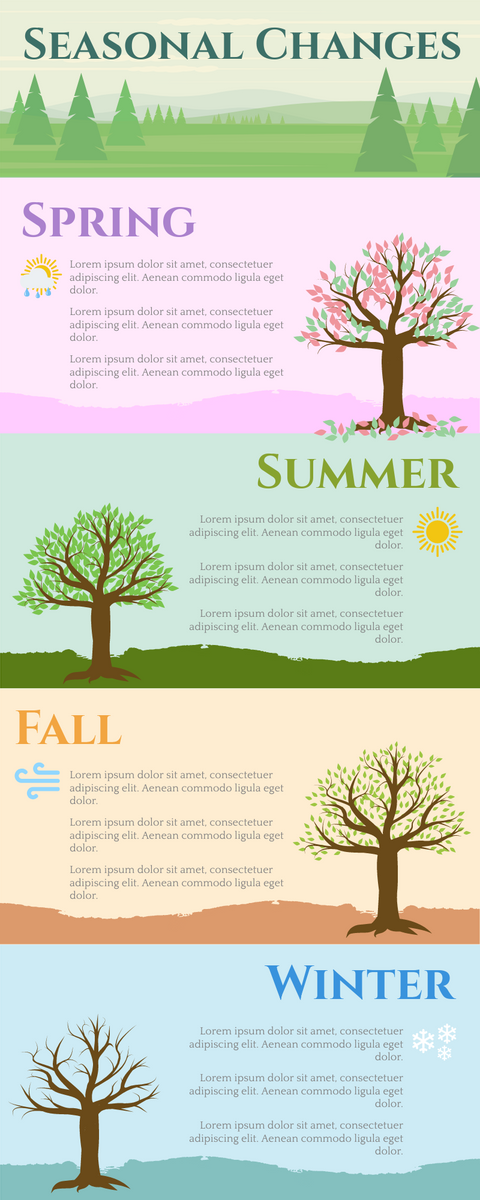
Seasonal Changes Infographic
In a year or 365 days, our Earth completes one rotation in the orbit around the Sun.
As the Planet travels in an orbit, the sunlight that each portion of the Earth absorbs varies.
This is due to the inclination of the Earth's rotation axis. The Sun looks to the northern hemisphere for half a year and to the southern hemisphere for the second half of the year because of this tilt. As a consequence, the earth's season varies. The northern hemisphere's season is the opposite of that of the southern hemisphere.
We break the year into four seasons: spring, summer, winter, and autumn. Every season lasts 3 months, with the warmest season being summer, the coldest being winter, and between spring and autumn. It has its own weather pattern and various hours of sunshine during the day.
Fun Facts of Seasonal Changes:
In reaction to the declining duration of the day, plants usually lose their leaves in fall.
Winter is unpleasant for animals and it is hard for them to find food.
Plants grow seasonal fruits and vegetables. Consuming vegetables and seasonal fruits can keep you well.
In all four seasons, some trees stay green. They call these trees evergreen trees.
Adopt the infographic template and customize it to accommodate your idea and create a nice presentation.
Try Visual Paradigm InfoArt by FREE!


