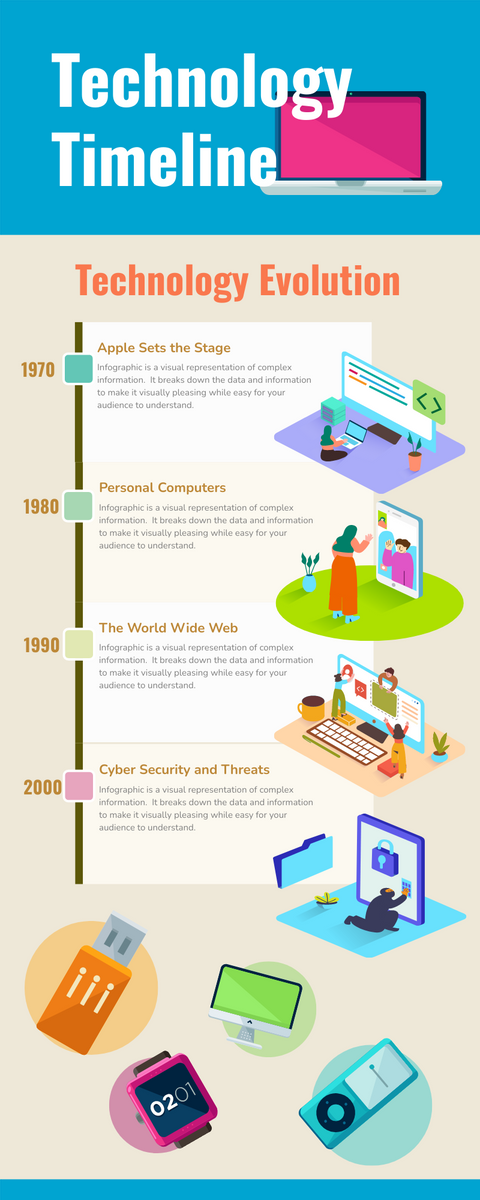
Technology Timeline Infographic
The timeline displays a list of events which is a graphical representation for visualizing a series of events in chronological order over a period of time. For example, they help relate the context of a story, process, or any other type of event by setting clear points in chronological order, either horizontally or vertically.
Many timelines use linear scales, where a distance unit is equal to a set time. The time scale depends on the events on the time axis. The evolution time line can be more than several million years, while the time line on the day of 9 / 11 attack can be more than a few minutes, and the explosion time line can be just only a few milliseconds. Thus, timelines are useful for tracking some form of development, offering an easy-to-understand history, and allowing audiences to understand past and current trends.
Use Infographic for Presenting your Timeline
Nowadays, more and more timelines are presented in the form of infographics, combining text and graphic images for better presentation. There many pre-made template and InfoART specially design for timeline.
Pick one beautiful pre-made template to jumpstart your design! Make your presentation professional and attractive. Try Now for FREE!


")


