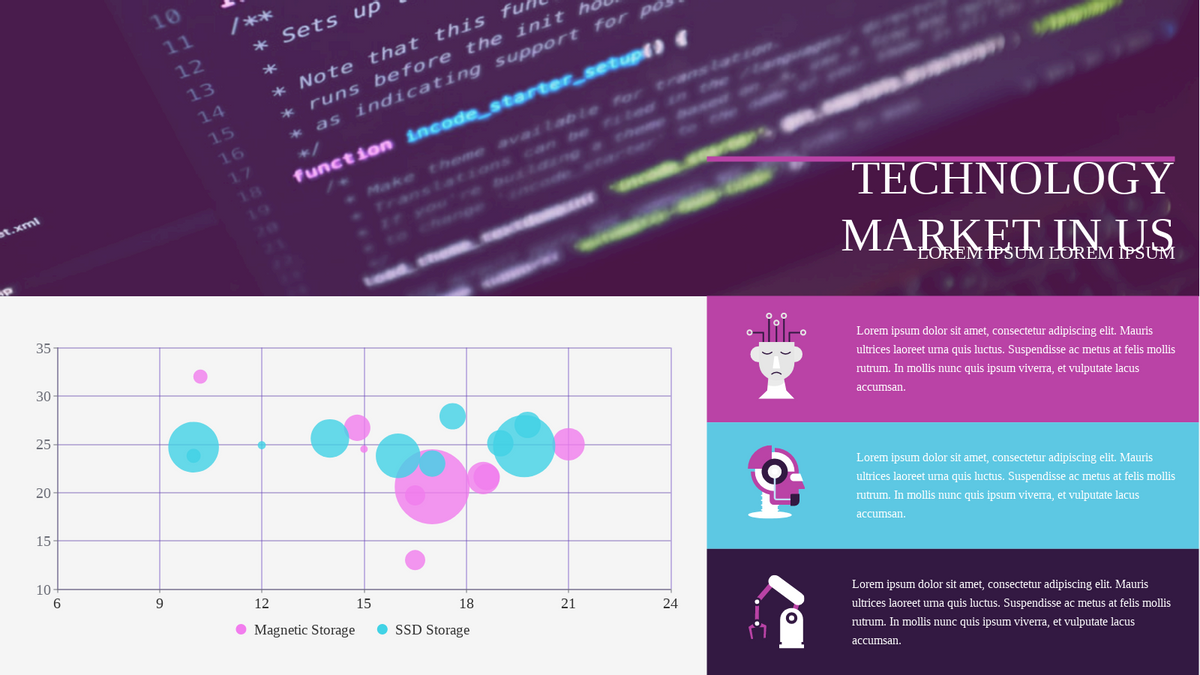
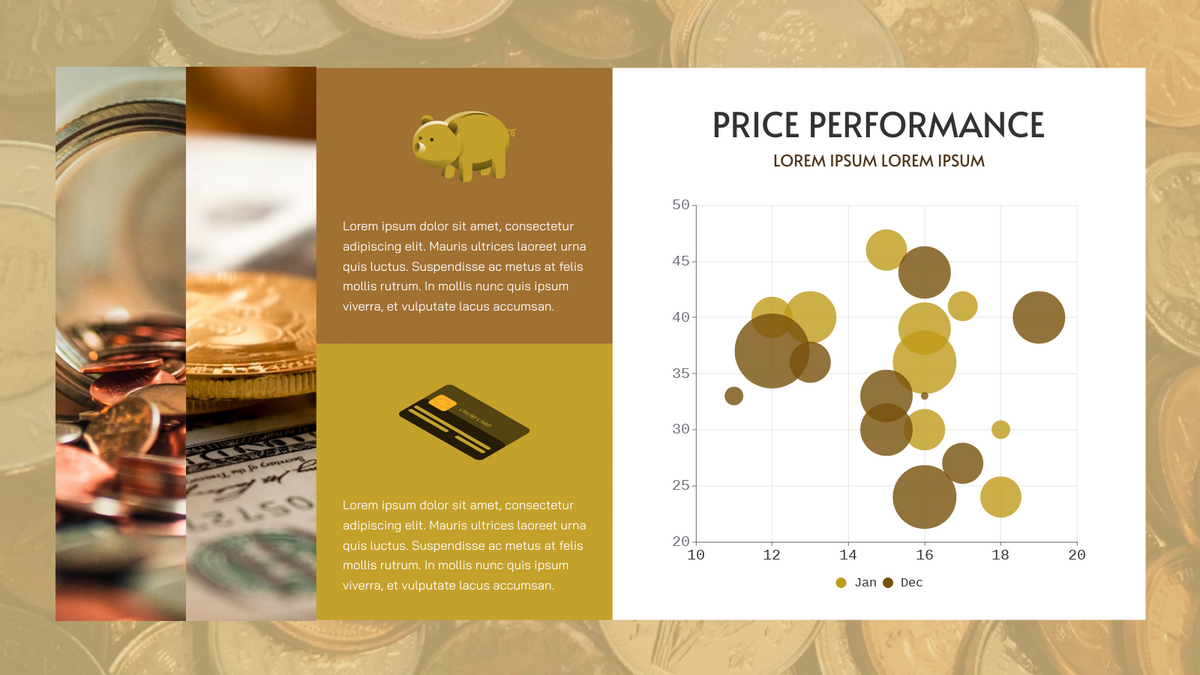
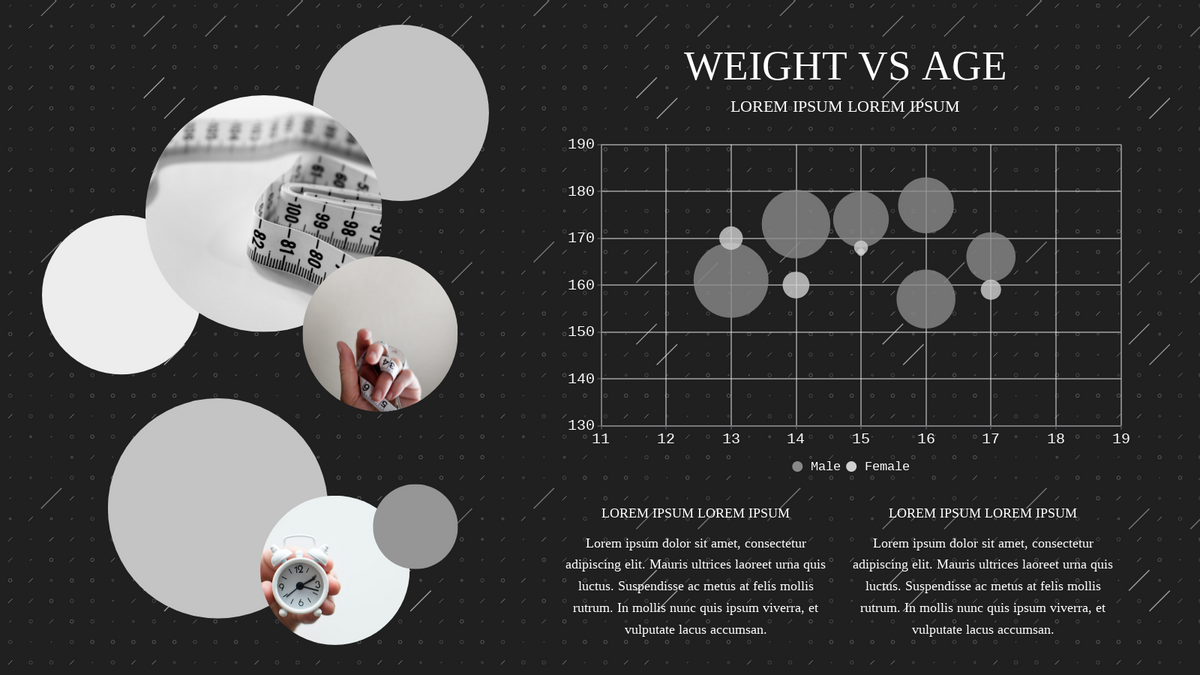
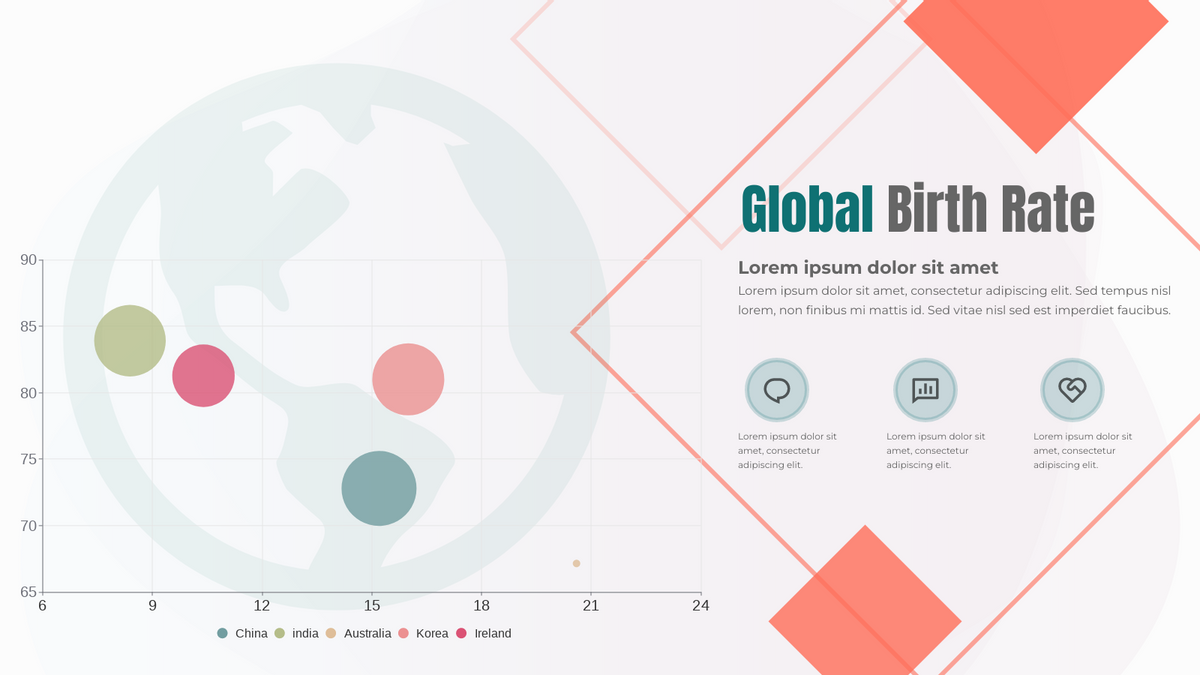
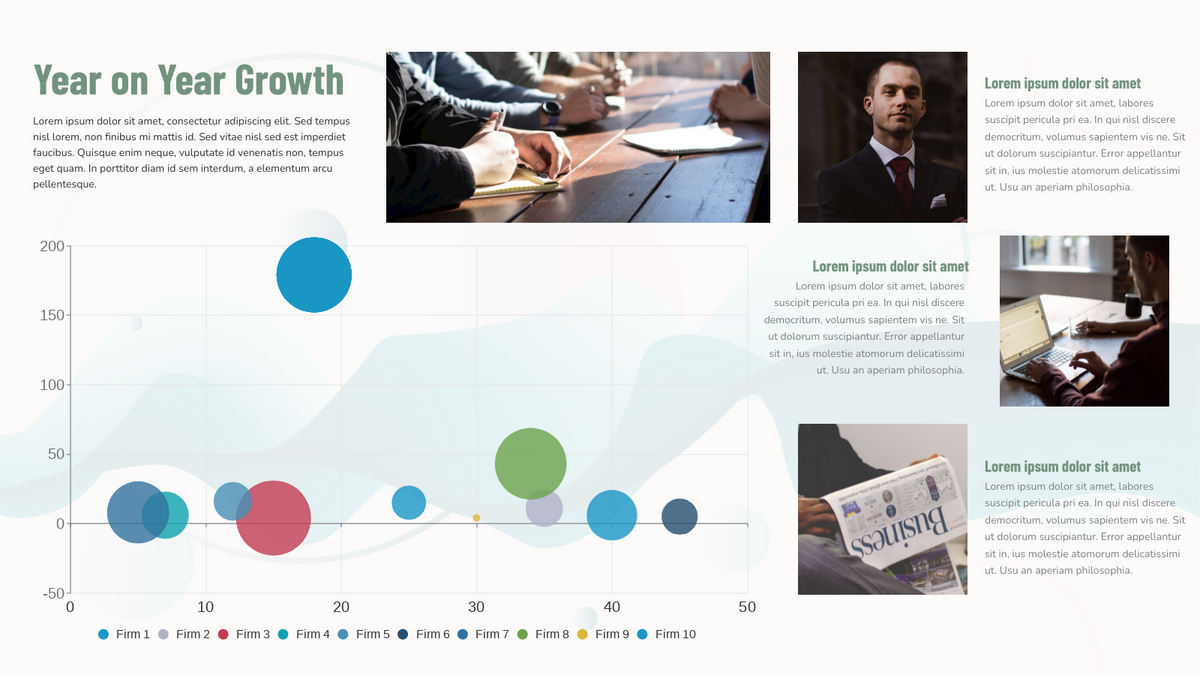
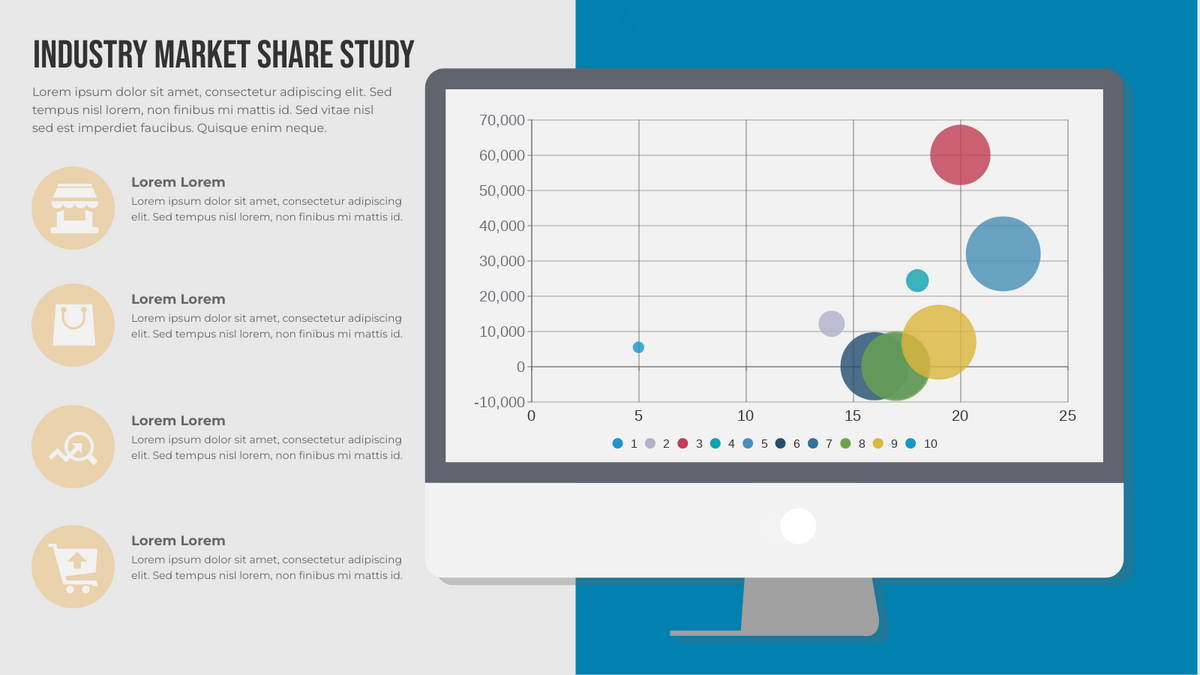
Charts are a great tool for communicating information in visual manner. With Visual Paradigm's chart maker, you can easily design and share your own charts online. We support a wide variety of different chart types like: bubble charts, pie charts, area charts, line charts, bubble charts and radar charts.
Bubble Charts Template Specifications:
Customizable:
Present data in a visually appealing and comprehensive way using this beautiful bubble chart template. Replace the data with your own. Customize the font styles, adjust the colors, and add photos and icons to compliment your message.
Dominant Color
Palette
Dimension
1600 x 900 px
