Charts are a great tool for communicating information in visual manner. With Visual Paradigm's chart maker, you can easily design and share your own charts online. We support a wide variety of different chart types like: doughnut charts, pie charts, area charts, line charts, bubble charts and radar charts.
Doughnut Charts Template Specifications:
Customizable:
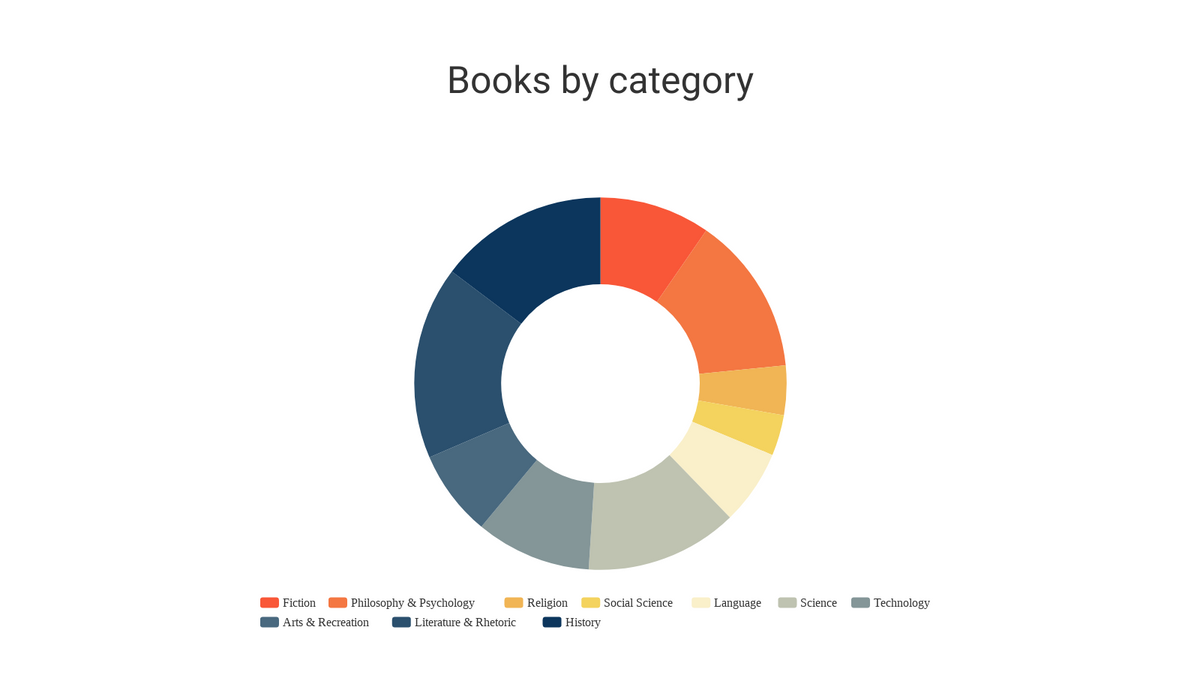
Here is a customizable doughnut chart template to help you showcase your data in a professional and attractive manner. The template is designed by our world-class design team. It is completely customizable so that you can make any changes from the color and fonts to the placement of icons and background, etc.
Dominant Color
Palette
Dimension
1600 x 900 px


