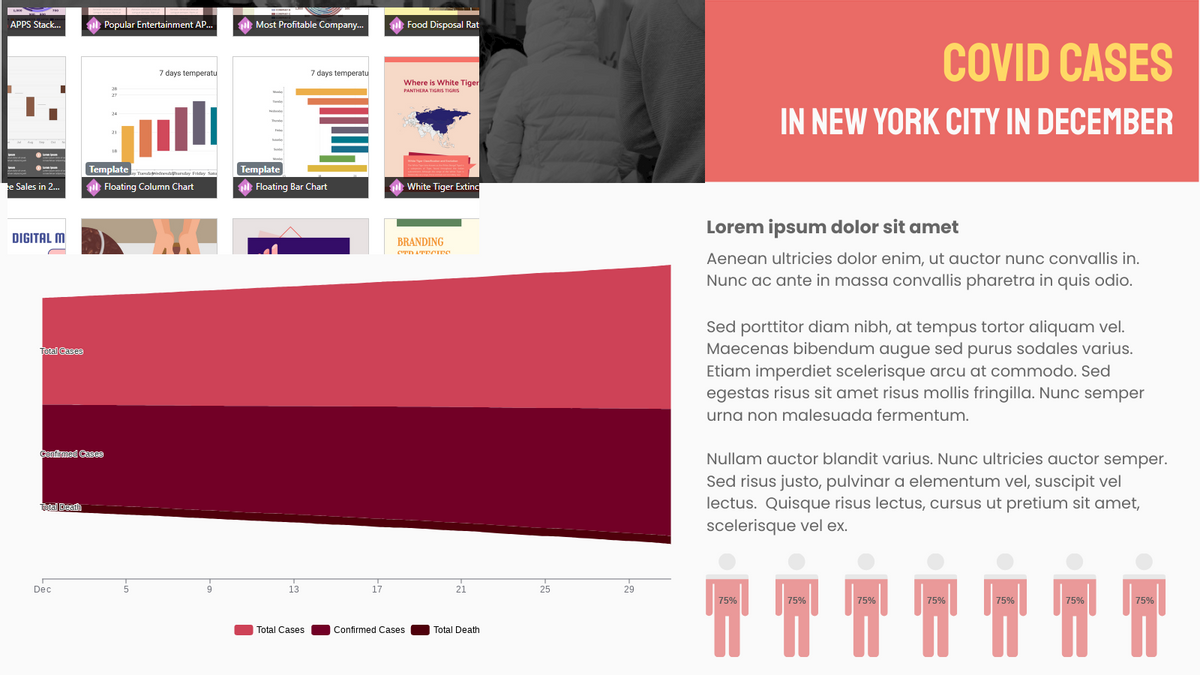
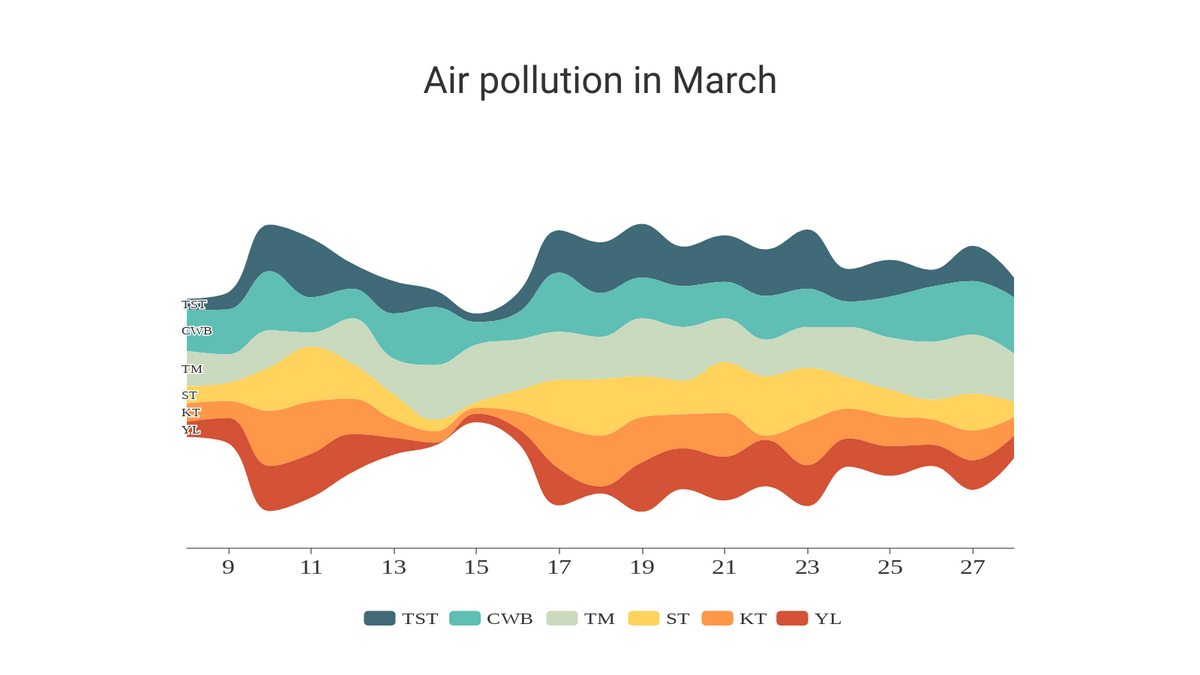
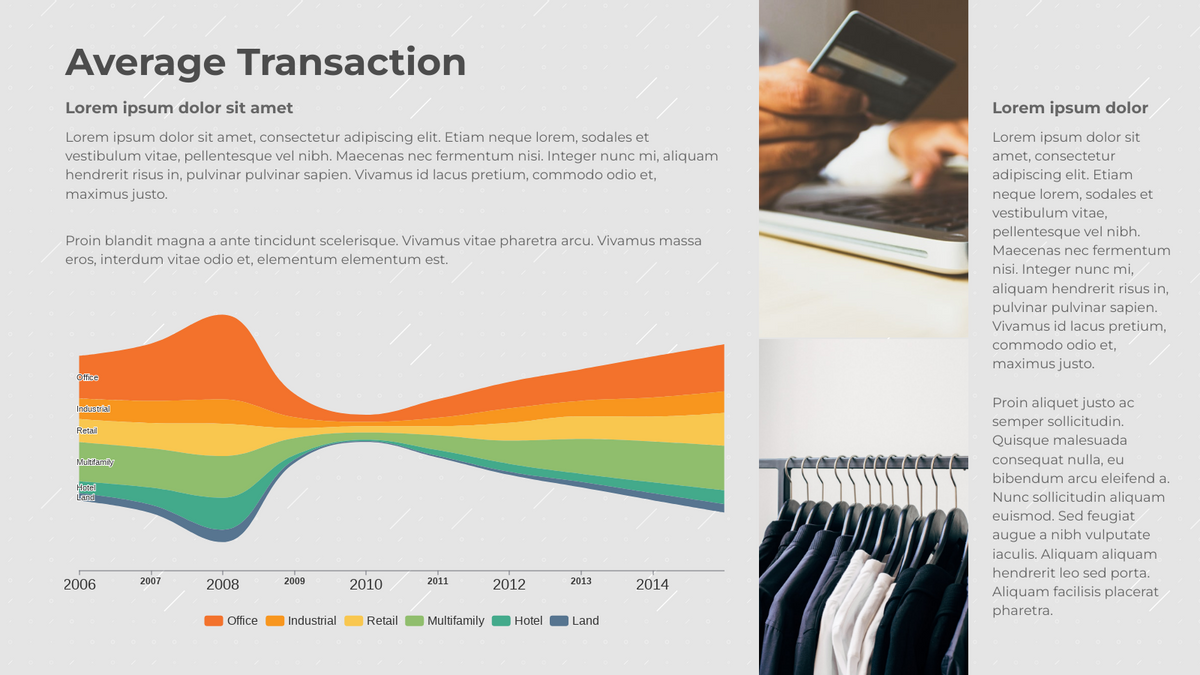
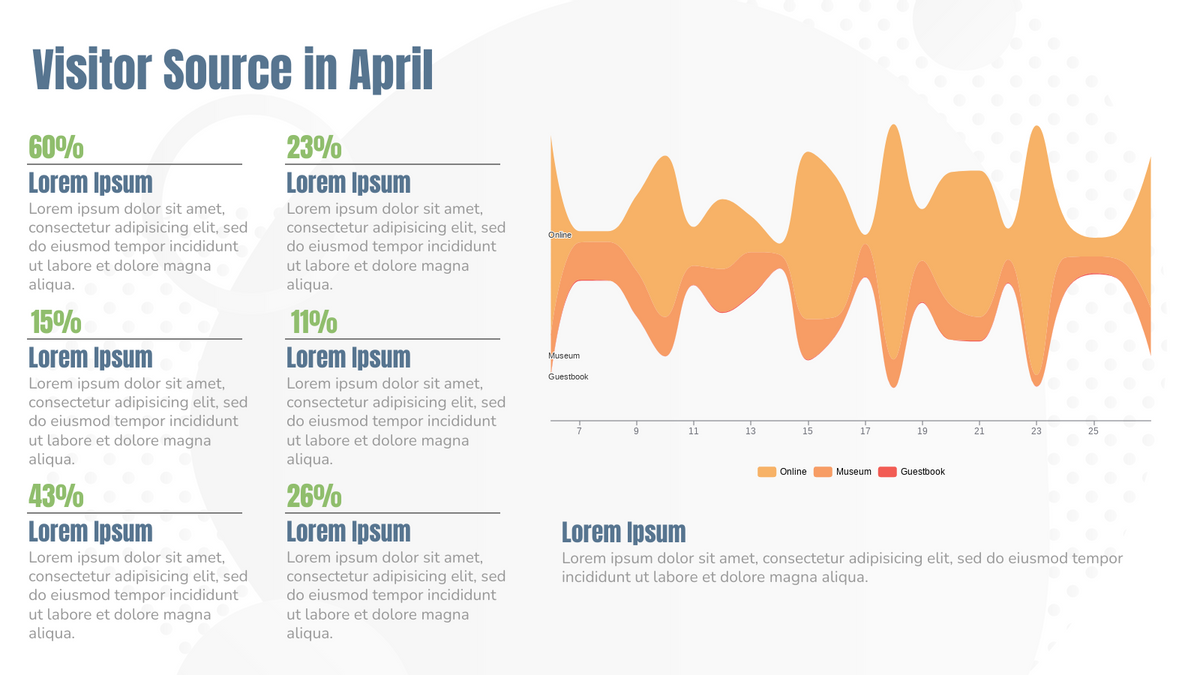
Charts are a great tool for communicating information in visual manner. With Visual Paradigm's chart maker, you can easily design and share your own charts online. We support a wide variety of different chart types like: stream graphs, pie charts, area charts, line charts, bubble charts and radar charts.
Stream Graphs Template Specifications:
Customizable:
Present data in an intellectual and attractive way. Here is a stream graph template to help you start quick. Simply click the Edit button below to begin. Edit your data, customize the color, font, image(s), etc. The easy-to-use stream graph maker helps you create amazing stream graph templates in minutes.
Dominant Color
Palette
Dimension
1600 x 900 px


