Decision flowchart
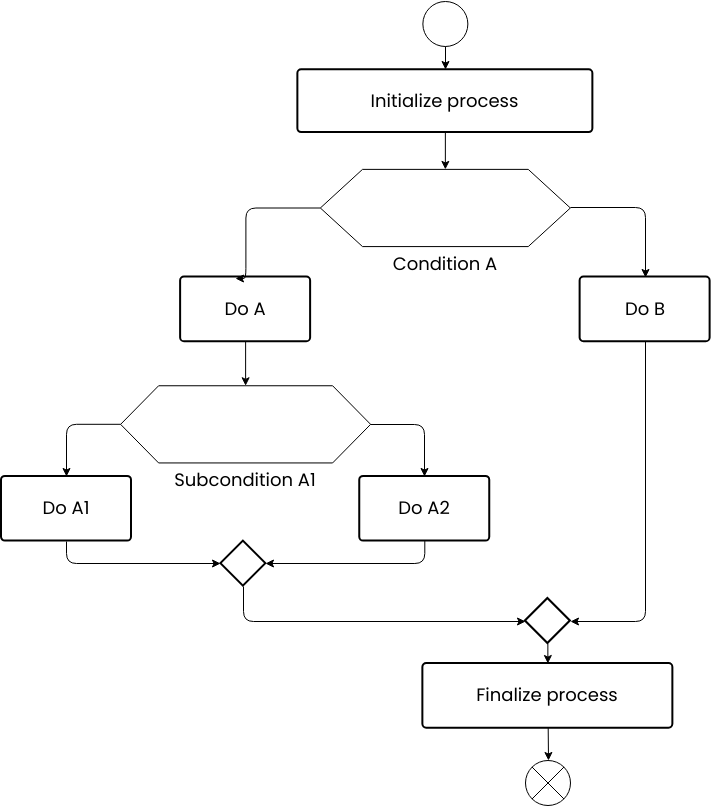
A Decision flowchart is a visual representation of the steps involved in making a decision. It outlines the steps involved in initializing the process, evaluating two conditions, and finalizing the process. The decision flowchart consists of four steps: "Initialize process", "Do A", "Do B", and "Finalize process".
The first step in the Decision flowchart is to initialize the process. This involves identifying the goals and objectives of the process and outlining the timeline and budget for completion. The second step is to do A, which could involve a variety of actions such as data processing, calculations, or document generation. The third step is to do B, which could involve a different set of actions than A, such as error handling, logging, or exception handling. Finally, the decision flowchart ends with the step to finalize the process, which involves completing any necessary documentation and archiving relevant data.
Overall, a Decision flowchart is an essential tool for making decisions effectively. It helps organizations to ensure that decisions are made consistently and efficiently, reducing the risk of errors or inefficiencies. By having a standardized process for making decisions, organizations can identify potential issues and make changes to improve overall performance. This can help to improve decision-making and reduce the risk of errors or miscommunications, ultimately contributing to the success of the organization.
Benefits of creating a flowchart
Creating a flowchart can provide several benefits for individuals or organizations. A flowchart is a visual representation of a process or decision-making steps, and it can help to improve the efficiency, accuracy, and overall performance of the process.
One of the main benefits of creating a flowchart is that it provides a standardized process or decision-making steps. This can help individuals or organizations to ensure that the process or decision-making steps are completed consistently and efficiently, reducing the risk of errors or inefficiencies. Additionally, having a visual representation of the process can help to improve communication among team members, reducing the risk of errors or miscommunications.
Another benefit of creating a flowchart is that it can help to identify potential bottlenecks or inefficiencies in a process or decision-making steps. By breaking down the process or decision-making steps into smaller, more manageable steps, individuals or organizations can evaluate the situation, determine the appropriate actions to take, and identify areas for improvement. This can help to save time and resources, ultimately contributing to the success of the individual or organization.
Searching for some flowchart templates? Go to Visual Paradigm Online and select some designs for customization now!


