Flowchart Tutorial
A flowchart is a picture of the separate steps of a process in sequential order that represents an algorithm, workflow or process, showing the steps as boxes of various kinds, and their order by connecting them with arrows. Flowcharts are used in analyzing, designing, documenting or managing a process or program in various fields for illustrating a solution model to a given problem.
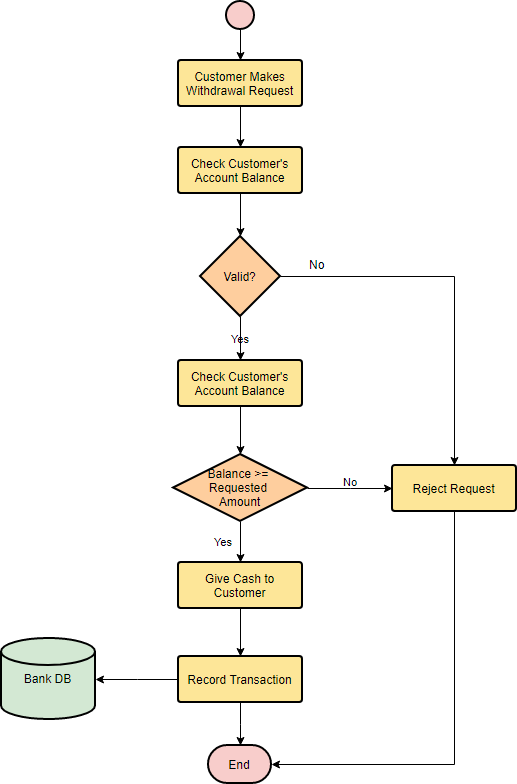
A flowchart is a diagram constructed from connected shapes representing a process or a plan. Here is an example of a simple flowchart illustrating the process of withdrawing cash.
What is a Flowchart
Traditionally, flowcharts originated in computer science as a tool for representing algorithms and computer programs, but the use of flowcharts has extended to the representation of all other kinds of processes. Nowadays, flowcharts play an extremely important role in displaying information and assisting reasoning. They help us visualize complex processes, or make explicit the structure of problems and tasks. A flowchart can also be used to define a process or project to be implemented.
Try it!
Finding an online Flowchart Diagram tool? Just click the draw button on the right to create your Flowchart Diagram online. It's simple and intuitive. You can also go through this Flowchart Diagram tutorial to learn about Flowchart Diagram before you get started.
Draw NowFlowchart Symbols
In a standard flowchart, different shapes have different conventional meanings. The meanings of some of the more common shapes are as follows:
Terminator
The terminator symbol represents the starting or ending point of the system.

Process
A box indicates some particular operation.

Document
This represents a printout, such as a document or a report.

Decision
A diamond represents a decision or branching point. Lines coming out from the diamond indicates different possible situations, leading to different sub-processes.

Data
It represents information entering or leaving the system. An input might be an order from a customer. An output can be a product to be delivered.

On-Page Reference
This symbol would contain a letter inside. It indicates that the flow continues on a matching symbol containing the same letter somewhere else on the same page.

Off-Page Reference
This symbol would contain a letter inside. It indicates that the flow continues on a matching symbol containing the same letter somewhere else on a different page.

Delay or Bottleneck
Identifies a delay or a bottleneck.

Flow
Lines represent flow of the sequence and direction of a process.

When to Draw Flowchart Diagram?
Using a flowchart has a variety of benefits:
- It helps to clarify complex processes.
- It identifies steps that do not add value to the internal or external customer, including: delays; needless storage and transportation; unnecessary work, duplication, and added expense; breakdowns in communication.
- It helps team members gain a shared understanding of the process and use this knowledge to collect data, identify problems, focus discussions, and identify resources.
- It serves as a basis for designing new processes.
How to draw a Flowchart Diagram?
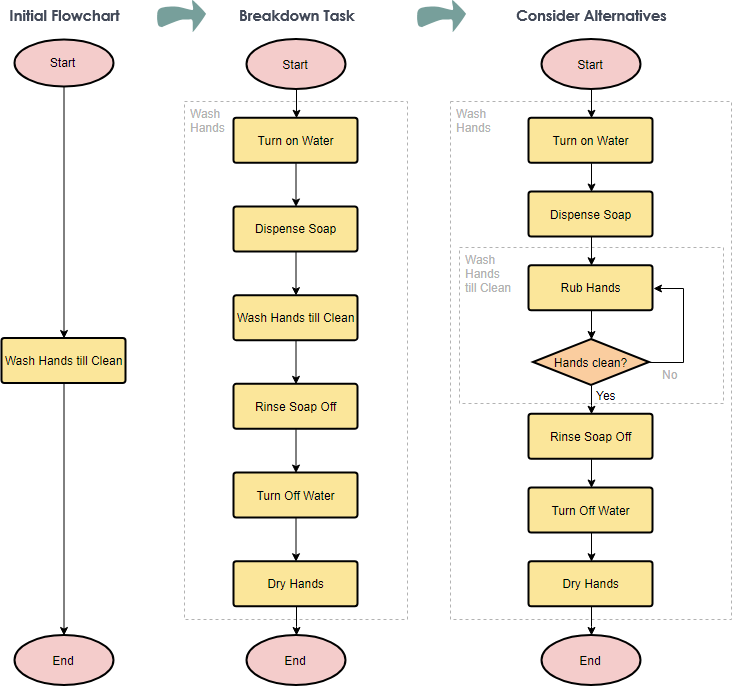
- How do you get from a complex task to an organized flowchart describing how to do it?
- Start with a flowchart containing just the task.
- Now break it down into smaller, more specific steps in another flowchart.
- Then, consider any possible exception in the flow, if so, add decision node for the alternative paths.
- Keep on repeating this process until you've reached steps that are simple enough for everyone to fully understand it.
Flowchart Diagram Examples
Flowchart Example – Hand Washing Example
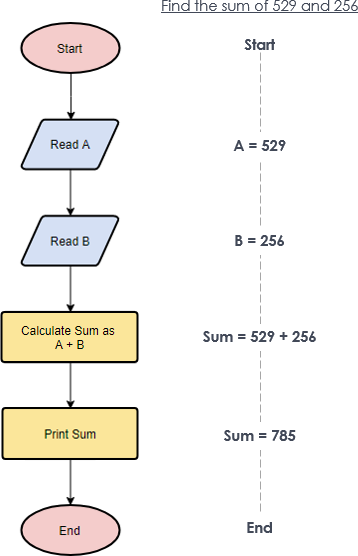
Flowchart Example – Simple Algorithms
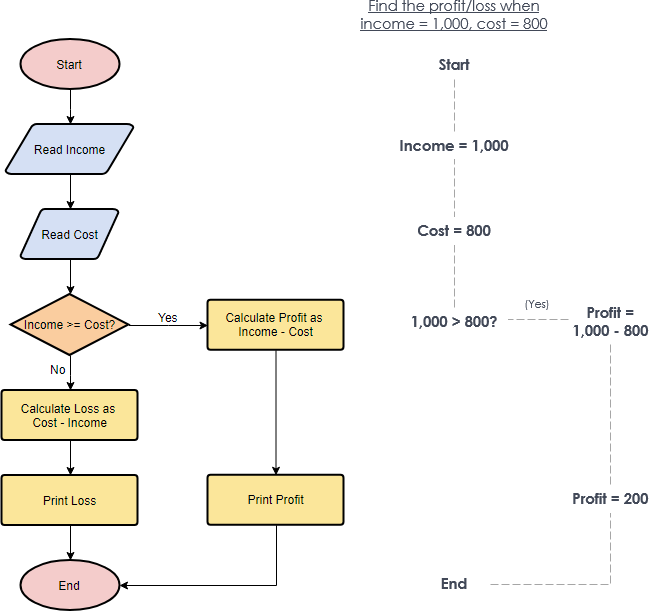
Flowchart Example - Calculate Profit and Loss
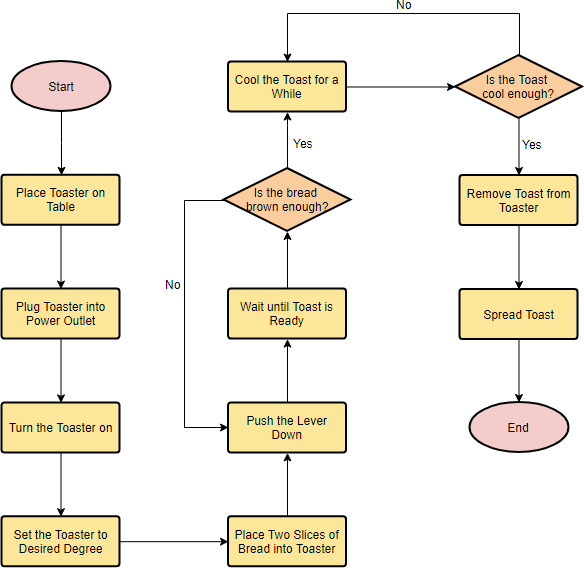
Flowchart Example - Example 1 – Make a Toast
Want to draw a Flowchart?
You've learned what a Flowchart Diagram is and how to draw a Flowchart Diagram step-by-step. It's time to get your hands dirty by drawing a Flowchart Diagram of your own. Try creating your own Flowchart with our Flowchart Maker. It's easy-to-use, intuitive.
Draw Now