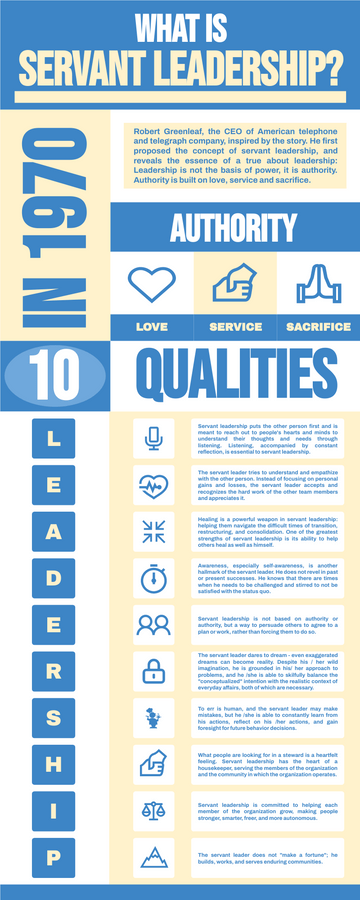
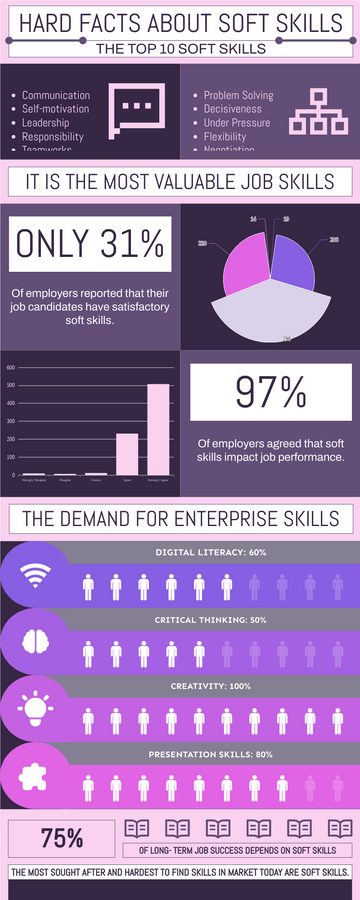
Infographic Of Warehouse Management
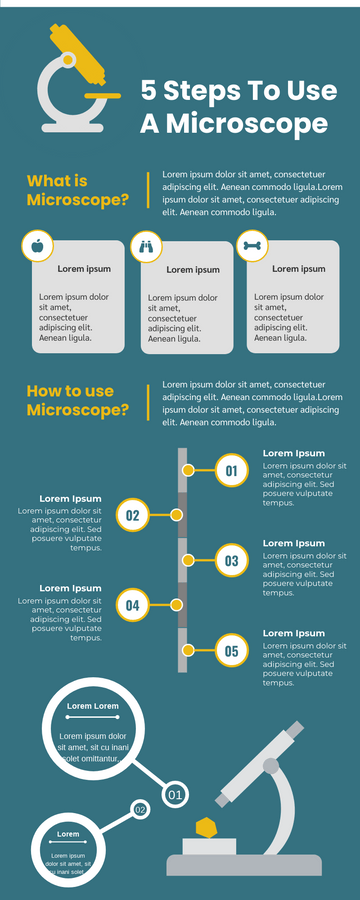
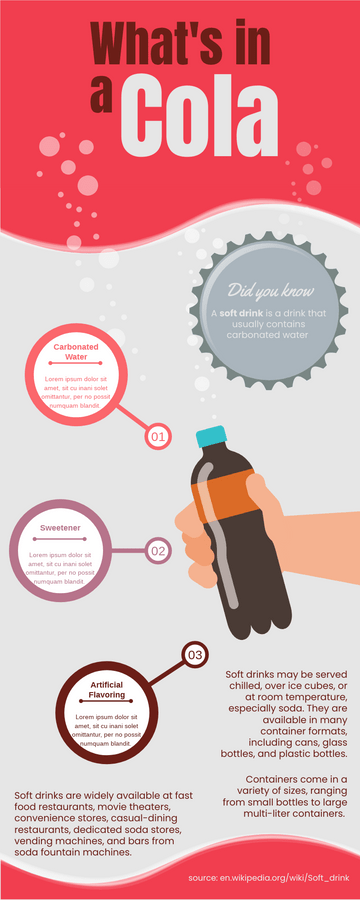
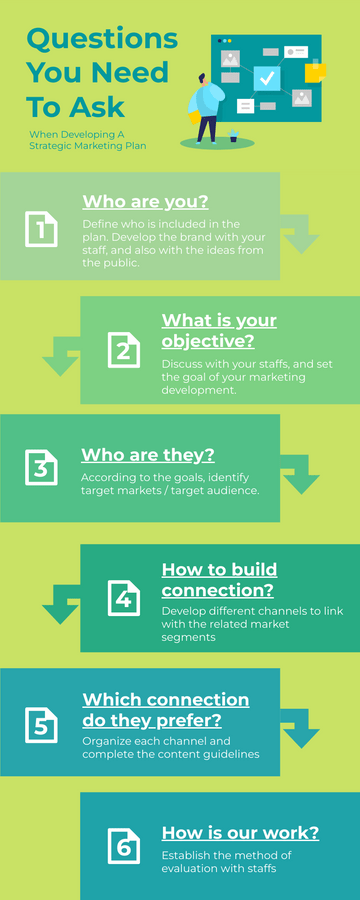
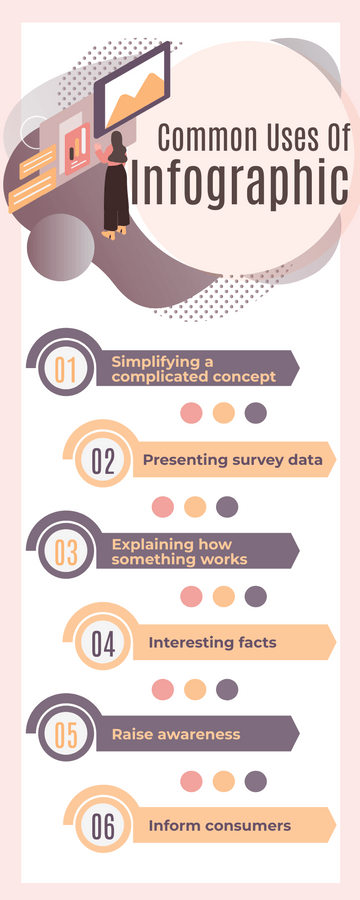
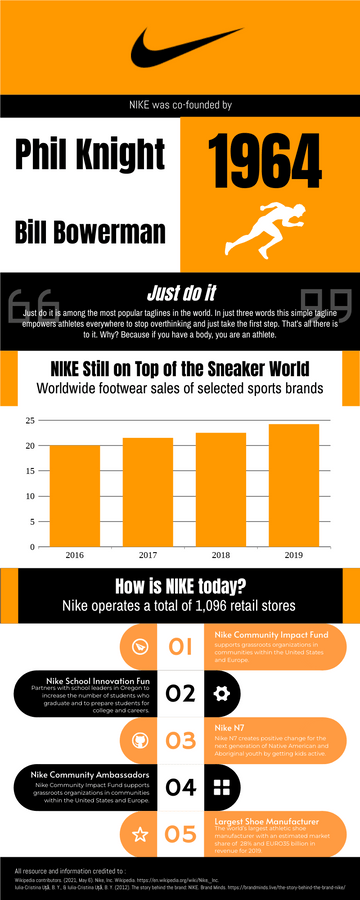
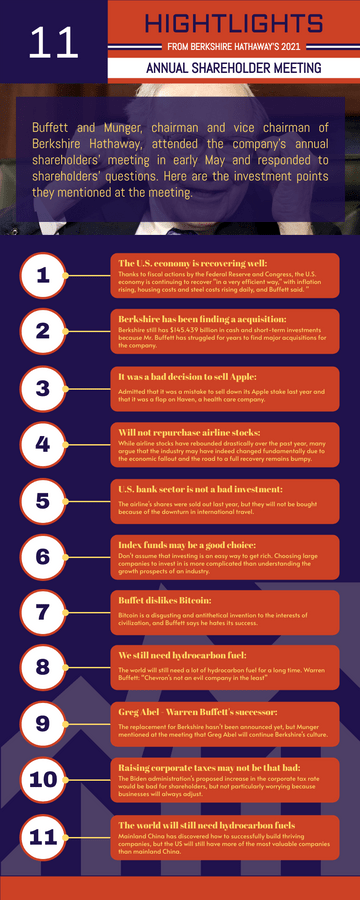
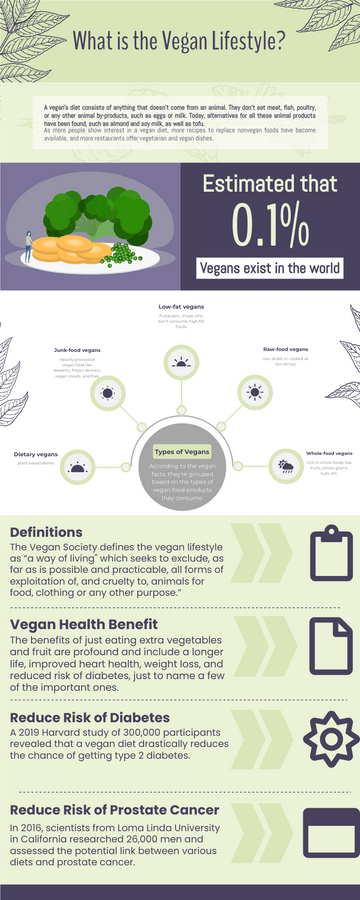
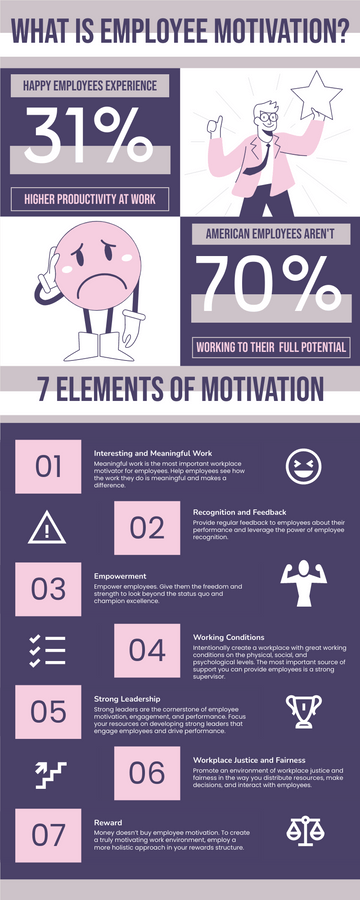
Infographics (a combination of "information" and "graphics") are graphical visual representations of information, data, or knowledge that are designed to present information quickly and clearly. They can use graphics to improve the human visual system's ability to recognize patterns and trends.
Infographics are an effective tool used by business owners and marketers to engage readers. Infographics are condensed from information that summarizes important facts and transforms them into easy-to-understand forms. Making infographics with Illustrator eliminates the need to read social media posts and is a popular way to convey complex messages to a wide audience.
Why Infographic Illustration?
People are visual. In fact, we only remember 20 percent of what we read. Imagine all the important things you read every day and narrow it down to less than a quarter of what you started reading. It's a little scary, right? We're visual because our brains, 90 percent of our brains process things visually, and we can process things much faster than text.
This applies online, too. On social media, the most popular thing people like and share is pictures. When you put infographics online, traffic even goes up significantly too!
Using Infographic to Visualize Warehouse Management
Warehouse management refers to the supervision of warehouse operation. This includes purchasing, manufacturing order, and storing inventory, as well as managing transportation, monitoring the movement of goods, and invoicing.
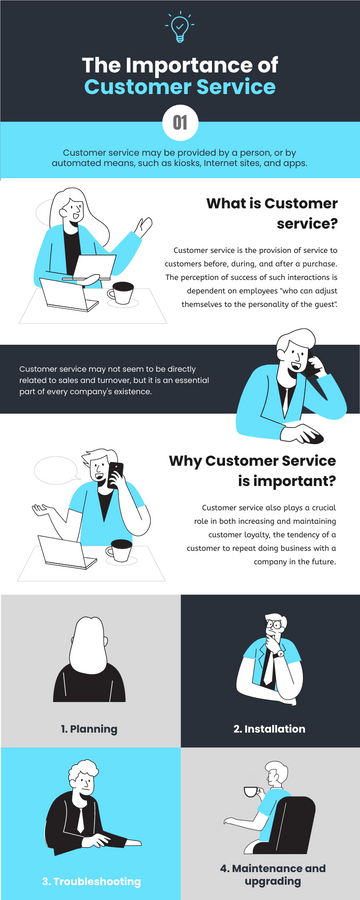
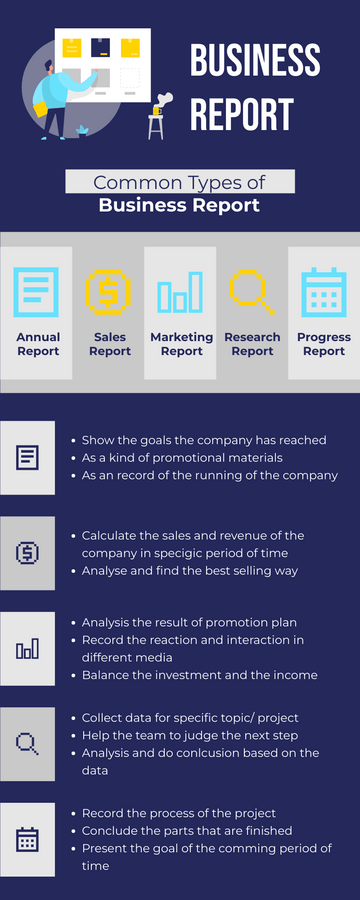
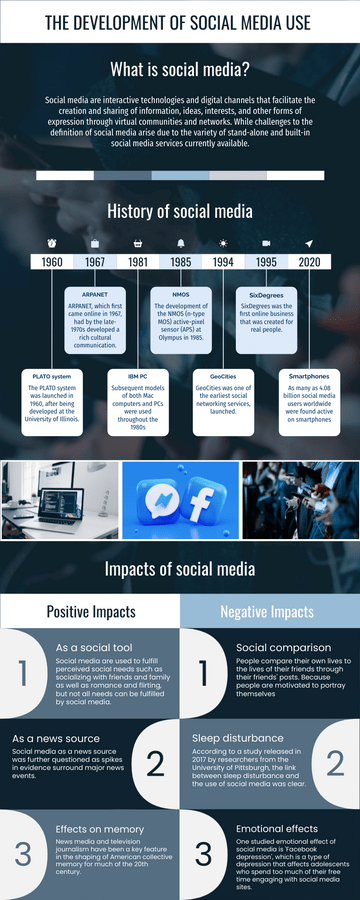
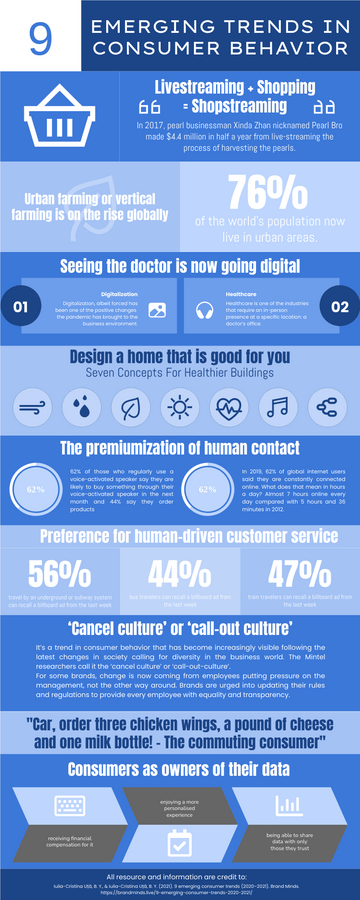
Here is an example of infographic illustration for warehouse management process.
If you experience growth and fulfillment of orders in an e-commerce warehouse, you need proper warehouse management and supervision. This requires experienced experts to manage the warehouse as well as the tools and facilities to support not only your business today, but your expected growth.
Try visual paradigm online to create your own infographics by using rich set of illustrations and pre created templates.

