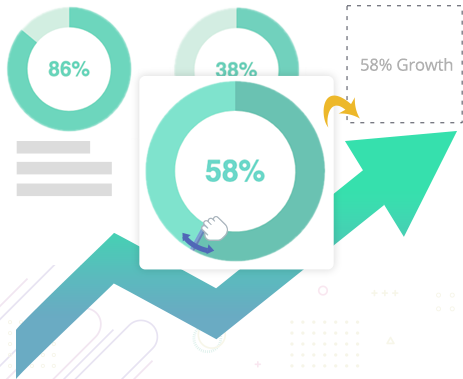
Beautiful Data Widgets
Visualize all kinds of data with easy and intuitive data widgets.
Browse Templates
Visualize all kinds of data with easy and intuitive data widgets.
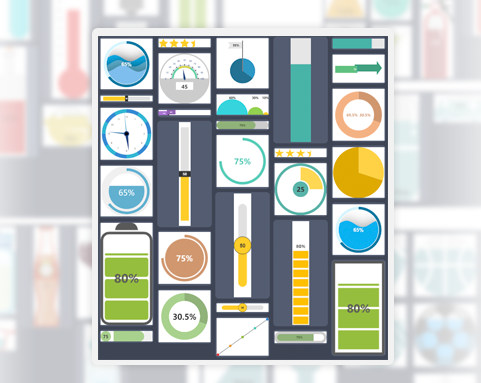
Hundreds of beautiful data widgets to visualize statistics and figures in your presentation, infographics, reports, posters, and more... These widgets cover a wide range of use cases and formats, including progress bars, gauges, containers, clocks, and more.
Customize the data widget to fit your data visualization needs. Adjust the value conveniently through drag-and-drop. Edit the color and font to fit into your design.