Flow Maps sequence a chain of events or processes, mapping the relationships between stages and sub-stages. They assist students with thinking more in-depth about a topic, i.e. teachers often use them in many ways to enhance the impact of classroom guidance lessons or small groups.
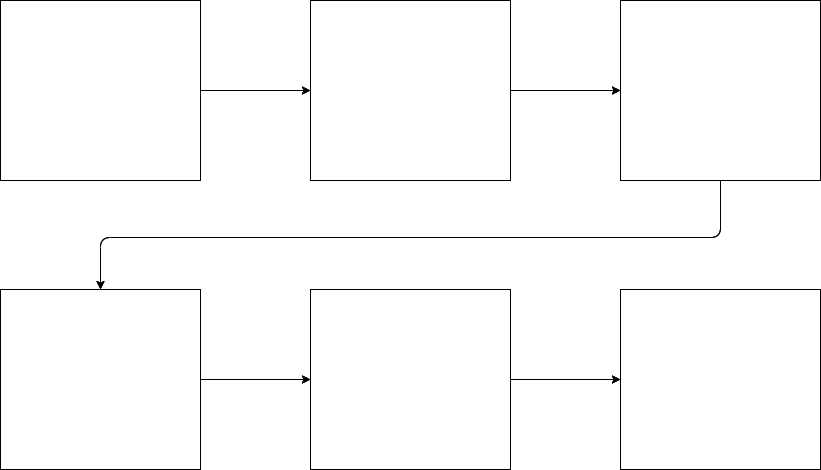
Write the name and date of the flow map for the event or sequence. The flow map lists the steps or events that follow from beginning to end. Each rectangle is linked to the next by an arrow, with each row starting on the left-hand side.
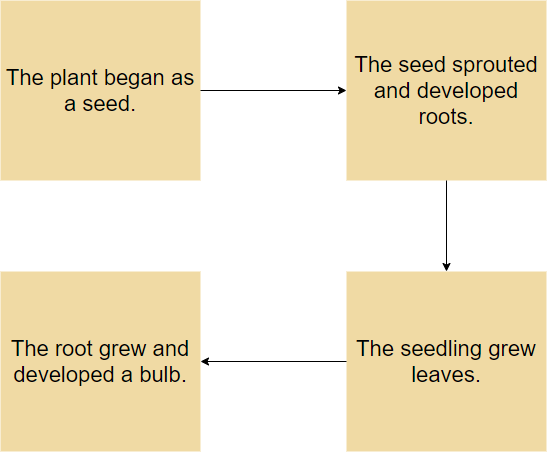
Example: Plant Growth
Multiple Level Flow Map
Flow Map can be used to plot a story, show historical events in sequences, steps in problem-solving math, and identify stages of a life cycle and much more. When you are attempting to understand a more complex problem, you can use a multiple-levels flow map.
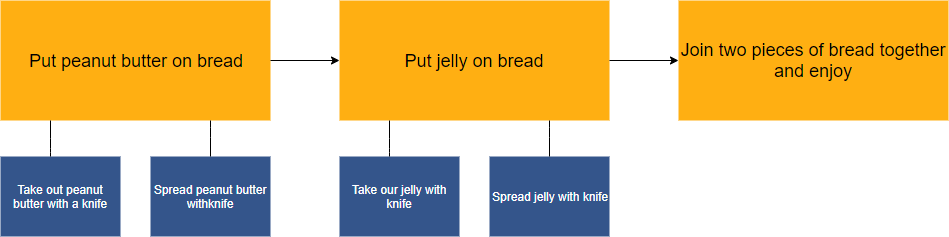
For example, the flow map is created with large rectangles. The sub-stages are in smaller rectangles below the larger ones as shown in the Figure below:
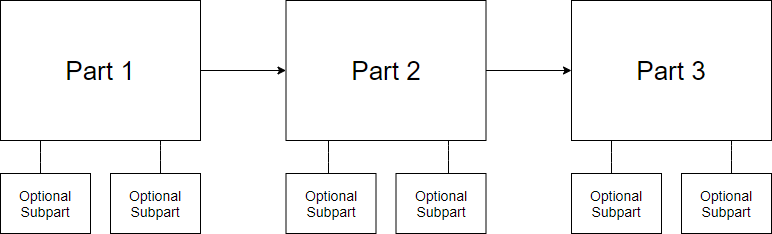
Example: Spread Peanut Butter on Bread
Events are always from left to right. Sub stages are the smaller boxes underneath the regular boxes. If you need to break a box up into smaller sub-stages.
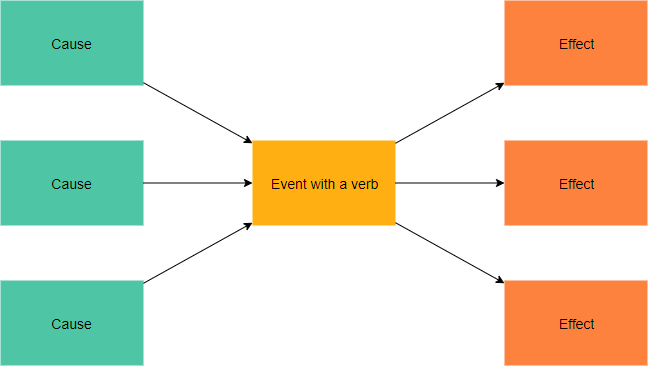
Multiple-Flow Map
Map Multi-Flow Map is used to display and analyze causality. In the center box are important events, the left is the cause of the event, and the right is the result of the event.