Data flow diagrams are used to graphically represent the flow of data in a business information system. DFD describes the processes that are involved in a system to transfer data from the input to the file storage and reports generation.
Gane-Sarson notation was introduced in Chris Gane and Trish Sarson’s 1977 book, Structured Systems Analysis: Tools and Techniques published in 1979. Gane-Sarson notation is used for data flow diagrams.
Gane-Sarson DFD Symbols
Four basic symbols are used in data flow diagrams as shown in the Table illustrated below:
- double square
- arrow
- rectangle with rounded corners
- open-ended rectangle (closed on the left side and open-ended on the right)
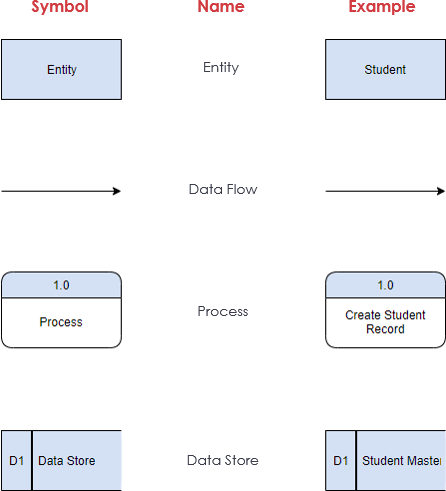
An entire system and numerous subsystems can be depicted graphically with these four symbols in combination.
Entities
Entities represent people, organizations, or other things that interact with the system, i.e. entities are “outside of the system,” that is they are part of a process, but external to the information system. They send or consume information, and in Gane-Sarson notation are also called sources or sinks of information. If the same entity is shown more than once in a diagram, a diagonal line is added to the lower right-hand corner to visually distinguish it.
For example, if the nurse entity was drawn twice, to keep from having a lot of diagonal line lines, a single diagonal line would be added to the lower right-hand corner. Further, if a medical assistant entity was similarly drawn twice on the same diagram, two diagonal lines would be added to visually distinguish it from the nurse and patient entities.
Process
Processes are the actions that directly change the data. Whenever an action takes place, a new output is formed based on that action. Typical processes include calculations, data sorting or set of specific rules that a business may follow.
- The process should be named or described with a single word (a verb), phrase, or simple sentence that describes what the process does.
- Similar to other notations, a good name will generally consist of a verb-object phrase such as check availability.
- In some cases, the processes are named for a role, an organization, or a machine that performs the process.
- Processes are given a number in the upper right-hand corner; this is an identifier and does not imply sequence.
Data Flow
Data flow is the lines with arrows that are used to mark where the data flows. As external entities create processes and interact with data stores, data flow lines map out these inputs and outputs. Data flow lines are an essential aspect of a data flow diagram as they tie all of the information together. They are also marked with labels that briefly define what each data flow is accomplishing.
- Gane Sarson notation uses straight arrows.
- Arrows should be named to indicate the meaning of the data that moves along the flow that is, a noun.
- Data flows with a verb name signify a process that has been omitted. Data flow in and out of a process must be altered in some way.
Data Store
Datastores are files or storage areas that contain information that can be called on at a later date. They typically appear as database tables or spreadsheets. Like processes, data stores receive simple labels explaining their purpose or order.
- The datastore is used to model a collection of data at rest.
- Datastores can be in computerized or non-computerized forms, such as paper charts, microfiche, index cards, etc.
- Stores are passive; processes put data in or read data.
- Like processes, data stores can be given an identifying number, e.g., D1, D2, etc., where “D” denotes a data store and the number serves as a unique identifier.
- Like entities, data stores can be drawn more than once on a diagram.
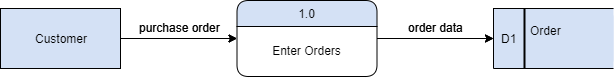
Gane-Sarson Data Flow Diagram Example
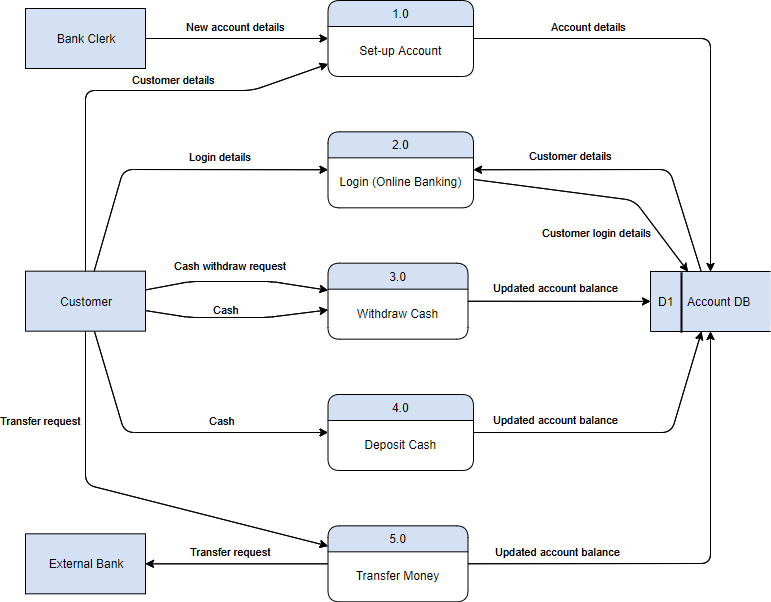
Edit this Gane Sarson DFD example
DFD Leveling with the Top-down Decomposition Technique
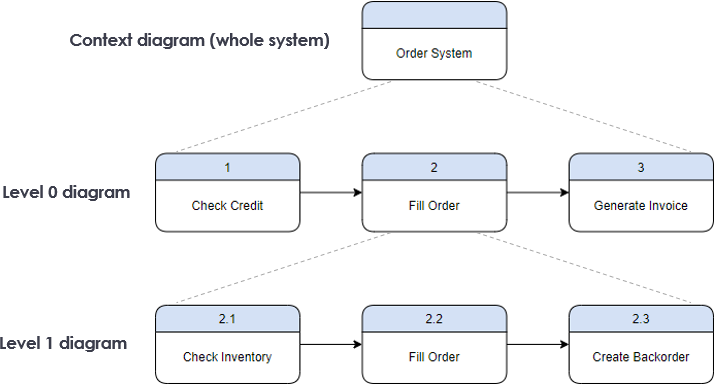
Gane-Sarson, like Yourdon notation, uses leveled diagrams, that is, a roll-up and drill-down approach where increasing levels of detail are shown on successive diagrams. A process called functional decomposition is used to represent each process in more detailed steps/processes. Each process in a DFD can be “exploded” to become a DFD. When this is done, decimal numbers can be used to identify the process, while maintaining the links to the “parent” or higher-level process on the parent diagram.
- A context diagram is the highest level.
- There is a detailed lower-level of DFDs as needed.
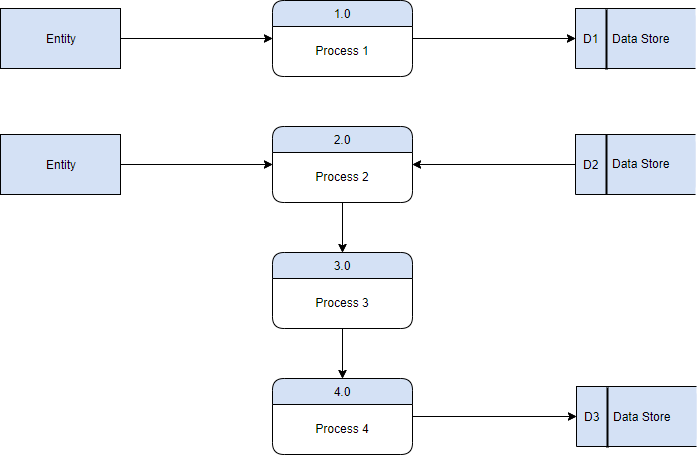
Rule of Data Flow
One of the rules for developing DFD is that all flow must begin with and end at a processing step. This is quite logical because data can’t transform on its own with being process. By using the thumb rule, it is quite easy to identify the illegal data flows and correct them in a DFD.
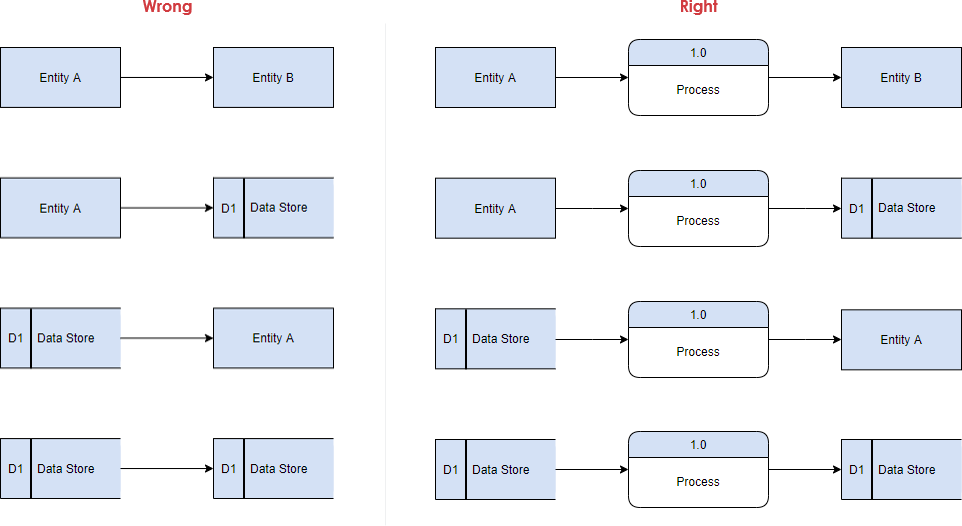
Note That:
- An entity cannot provide data to another entity without some processing occurred.
- Data cannot move directly from an entity to a data story without being processed.
- Data cannot move directly from a data store without being processed.
- Data cannot move directly from one data store to another without being processed.
Logical vs Physical DFDs
Data flow diagrams can be divided into logical and physical. The logical data flow diagram describes the flow of data through a system to perform certain functions of a business. The physical data flow diagram describes the implementation of the logical data flow.
Logical DFD
- Logical DFD depicts how the business operates.
- The processes represent business activities.
- The data stores represent the collection of data regardless of how the data are stored.
- It’s how business controls.
Physical DFD
- Physical DFD depicts how the system will be implemented (or how the current system operates).
- The processes represent the programs, program modules, and manual procedures.
- The data stores represent the physical files and databases, manual files.
- It shows controls for validating input data, for obtaining a record, for ensuring successful completion of a process, and for system security.
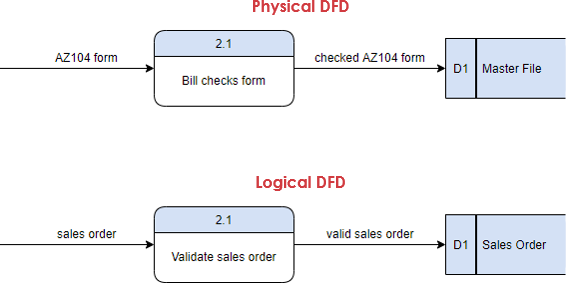
Physical and Logical DFD: Example 1
Physical DFD specifies the actual flow of physical documentation, while logical DFD only focuses on the information flow in business terms.
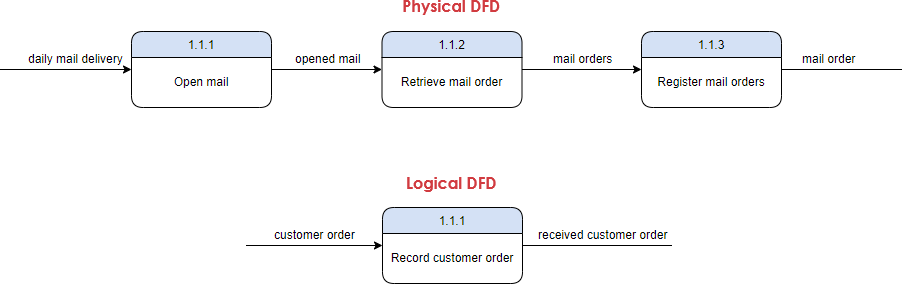
Physical and Logical DFD: Example 2
Logical DFD eliminates physical processes that refer to physical activities only and do not transform data.
Gane Sarson Diagram Template