People often employ different thinking skills (comparison, categorization, association, etc.) to assist us in the thinking process. For example, students use thinking tools, such as a, Y-Chart and X-chart or Venn diagram to organize and visualize their ideas on a specific topic. They also share their written ideas with others in the class, through which they learn thinking skills.
Both X and Y Chart are used to categorize and organize things. In this article, I will introduce what are they and show the difference between them.
Y chart vs X Chart
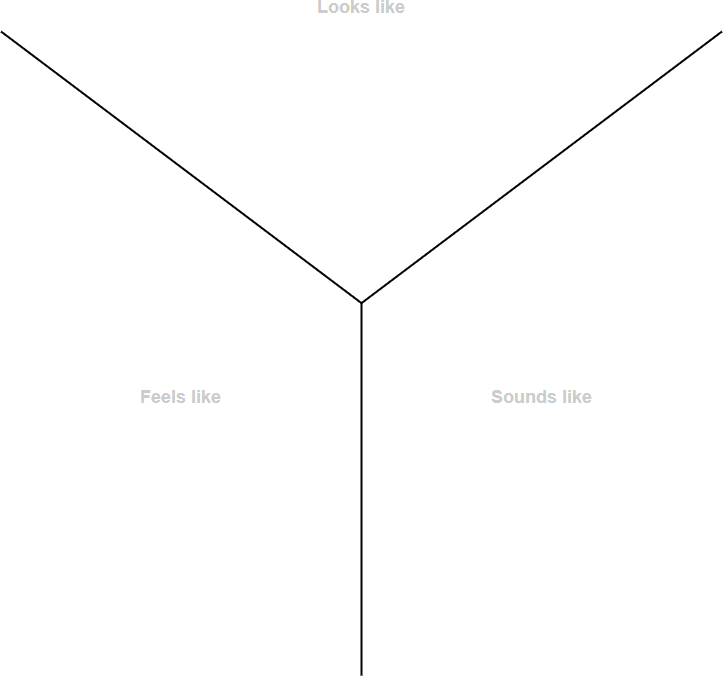
Y-Charts are a type of three-part chart, a graphic organizer. For example, a student can use a Y-Chart to help organize what they know about a topic by writing and/or drawing what the topic looks like, feels like, and sounds like. The student must think about a topic with respect to three of their senses, sight, hearing, and touch.
In this case, the Y-Chart has sections in which the student writes and/or draws:
- What it looks like,
- What it sounds l
- What it feels like (or how a character feels).
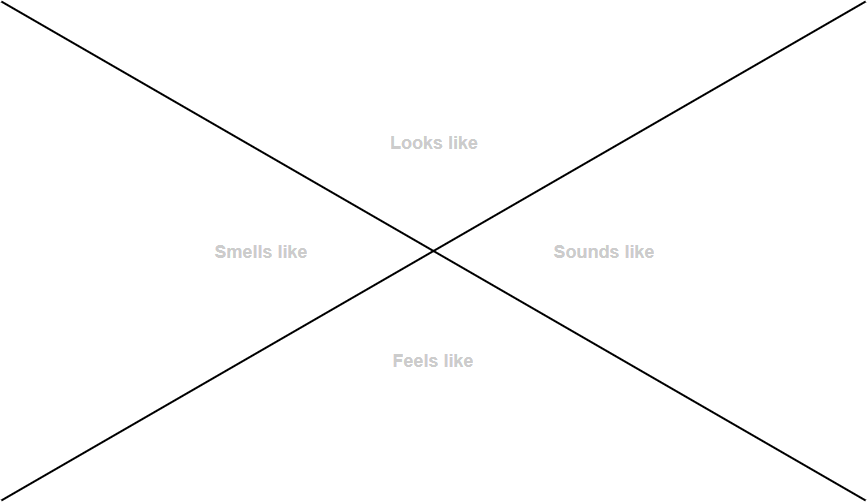
X Chart is similar to the Y-charts but provides an extra dimension. The X chart adds thoughts as the fourth dimension – “thinks like” related to the topic – that is; Learners can record their ideas about what they see, feel, hear, and think. This is particularly important for adding an affective aspect to the scenario being described.