Process Map Designer

Boost Your Business Productivity with a Powerful Process Map

Process Map Designer

Ridiculously Useful and Powerful


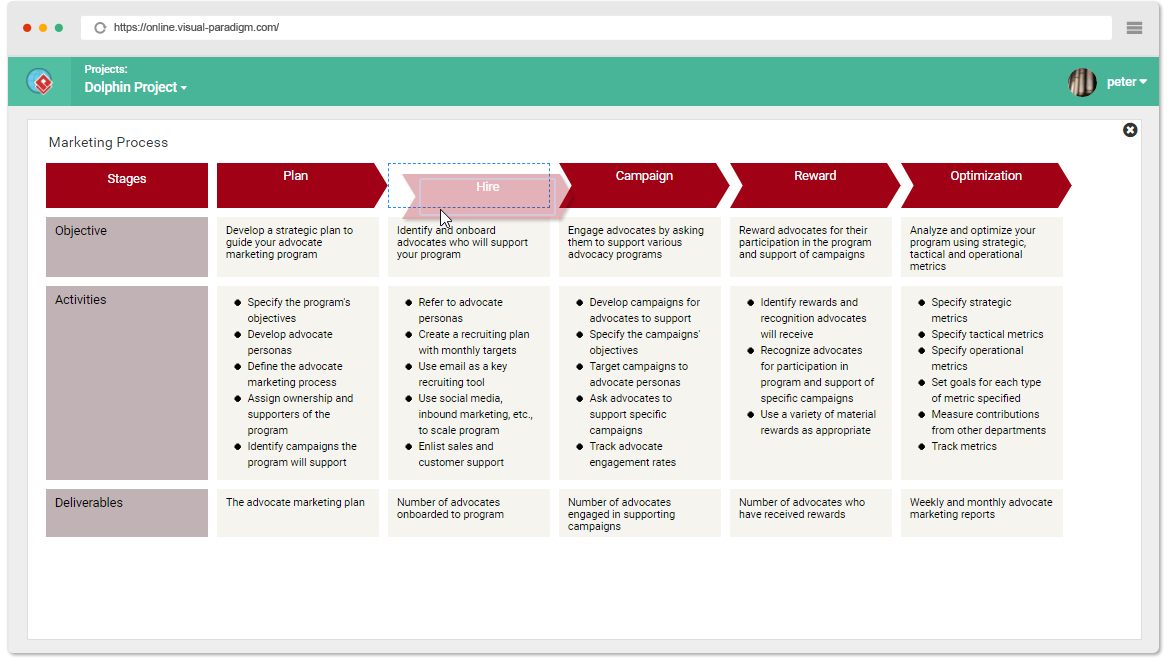
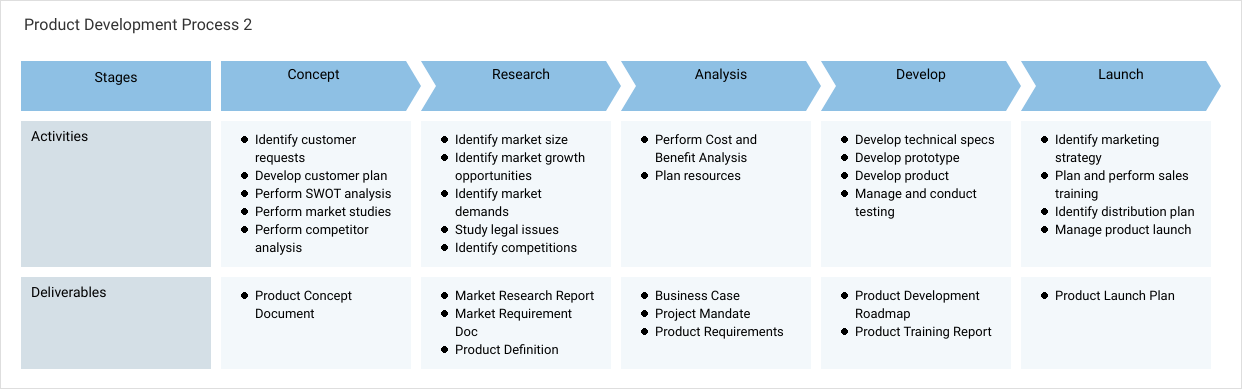
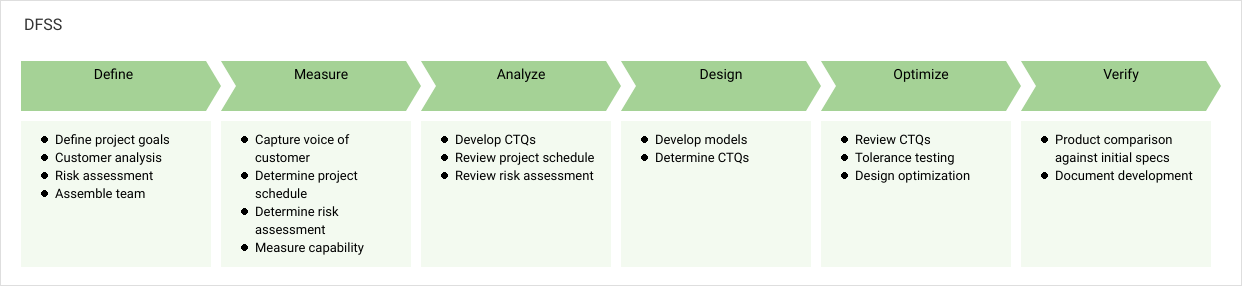
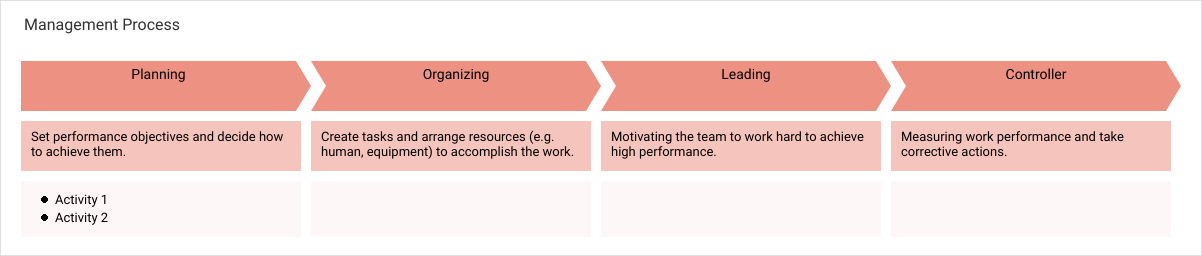
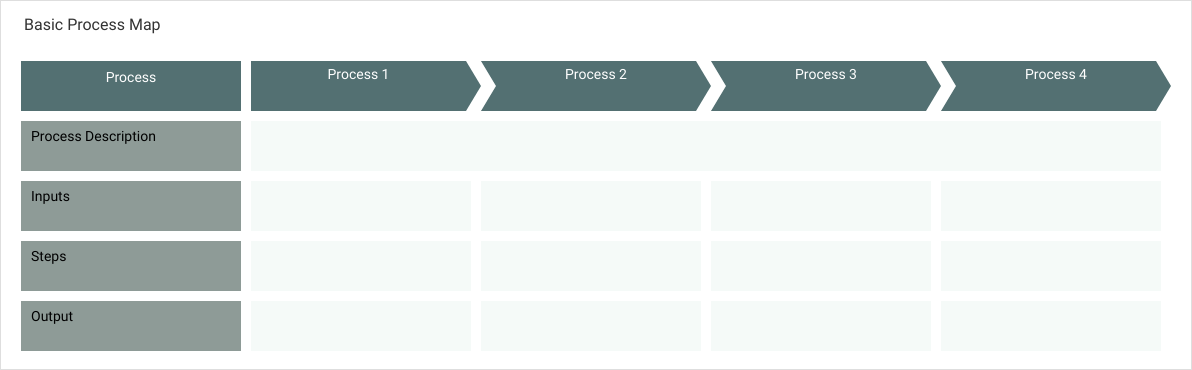
Process Map is a widely accepted way to structure and present business process ideas. VP Online features a powerful yet simple process map designer that makes the definition of business process fast and simple. Below, we'll discuss the most common ways you can use process map to make your business more efficient and productive.

Use image in cells

Define Business Process

Define your business process by documenting its process flow, steps, responsibility and outcome all in a comprehensive process map. You can set up the maps with the columns, rows, and format in just a few clicks.

Use image in cells

Improve Communication

By defining your business processes as process maps and putting them in the hands of your team, team members can understand and follow without ambiguity. The matrix format also makes communication quick and convenient.

Use image in cells

Use as Analysis Tool

process workers can use the process map designer for analysis by taking advantage of its matrix interface. A rich set of analysis tools are provided for root cause analysis, competitor analysis and more, while you can still create your own in just a few clicks.

Define process in just few steps

VP Online is simple and intuitive. You can create columns, rows and toggle cell editing all with simple mouse clicks, and re-arrange columns and lanes drag-and-drop.

Few-clicks to create a map

Multiple data formats

As a flexible process mapping tool, VP Online supports multiple cell formats to fit different process definition needs. You can create a cell of text, item list, numbered item, etc.s

Multiple data formats

Use image in cells

Get bored with using text to describe activities? Try images. Create visually stunning process map by using images. You can use image in a particular cell, a row of cells or all cells. It's up to you!

Use image in cells

Mergeable cells

Combine all the cells in a row to become one, which is particularly useful when you want to include process-wide information (e.g. process background) in the map.

Mergeable cells

Data visualization with charts

You can include different kinds of chart into your process map to present statistical data. Besides traditional chart types such as column chart, line chart and area chart, advanced chart type like emoji chart is provided, making it so easy to present the change of emotion throughout a process.

Data visualization with charts

40+ process templates for different industries and businesses


Ready to create your process map? Hold no. Instead of starting things from scratch, you may start with an existing process map template and customize it to suit your business needs. VP Online comes with a large collection of process map templates for a wide variety of needs. Below, we will list out some of the process templates. Click on an image to view it or click the Edit button to start editing straight away. More process map examples are available in the process map software.

Much more than a Process Map Designer

Get Started Now

Create diagrams and charts in a simple and flexible way.

Start Drawing for Free
Flowchart Maker
System Design Tool (e.g. UML)
Cloud architecture design tool (e.g. AWS)