Simple Grading System
The Simple Grading System flowchart template outlines a straightforward grading system. The flowchart includes actions such as obtaining a score, determining the score range, and identifying whether the student has passed or failed.
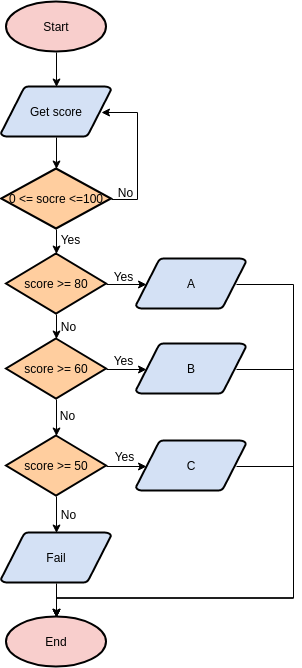
The flowchart begins with the start symbol and proceeds to the action of obtaining a score. The flowchart then checks if the score is within the valid range of 0 to 100.
If the score is equal to or greater than 80, the flowchart indicates that the student has achieved a high score. If the score is between 60 and 79, the flowchart suggests that the student has achieved a passing grade. If the score is between 50 and 59, the flowchart indicates that the student has failed.
The flowchart concludes with the "Fail" outcome, indicating that any score below 50 results in a failing grade.
This flowchart provides a visual representation of the sequential steps involved in determining the grade based on a given score.
The template has been designed using Visual Paradigm Online, a versatile and user-friendly diagramming tool. Visual Paradigm Online offers a wide range of features and capabilities, making it an ideal choice for creating professional-grade diagrams like the Simple Grading System flowchart.
With its intuitive interface and collaborative features, Visual Paradigm Online enhances the diagramming process, enabling users to create visually appealing and informative diagrams efficiently.


