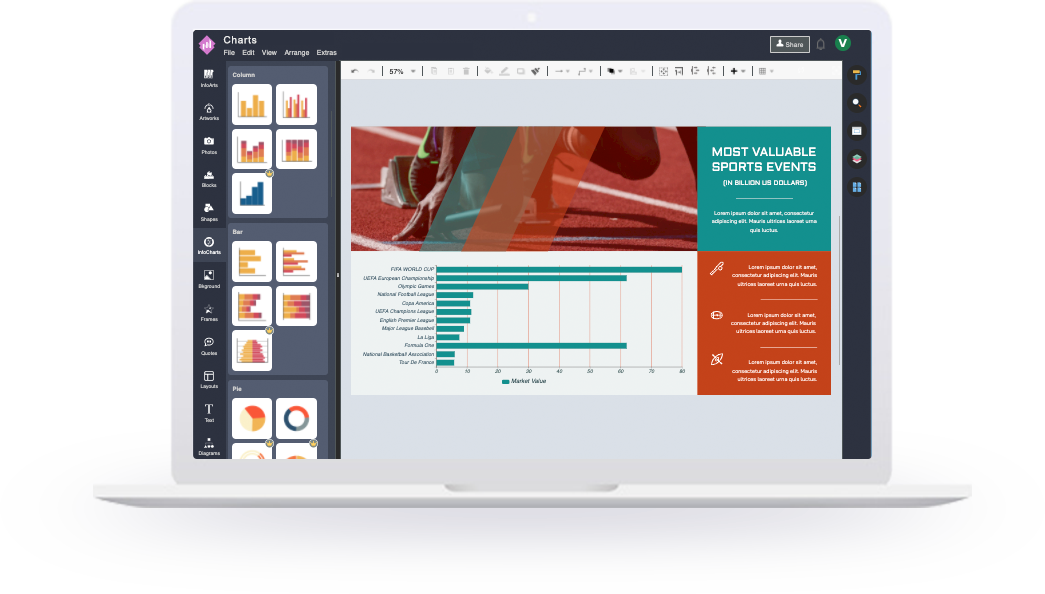
Online Bar Chart Maker
Visualize your data and statistics quickly and easily with Visual Paradigm's online bar chart maker.
Create Your Chart
Visualize your data and statistics quickly and easily with Visual Paradigm's online bar chart maker.
Millions of stock photos and icons to spice up your design
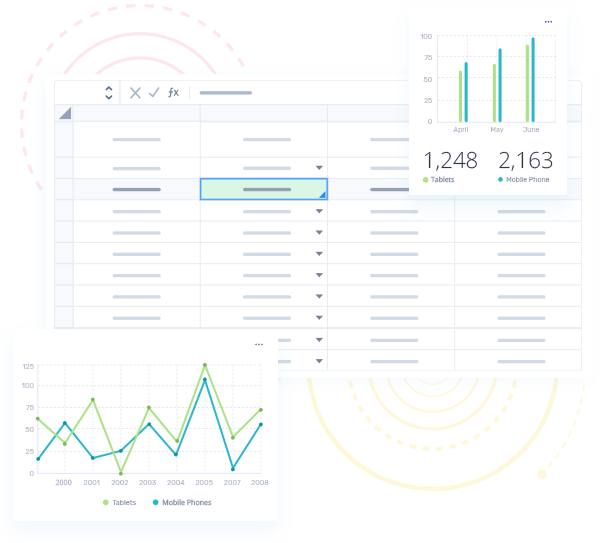
Drag and drop tools for chart value adjustment
Publish, share and download your chart in high resolution
Switch between chart types in one-click. No re-work needed.
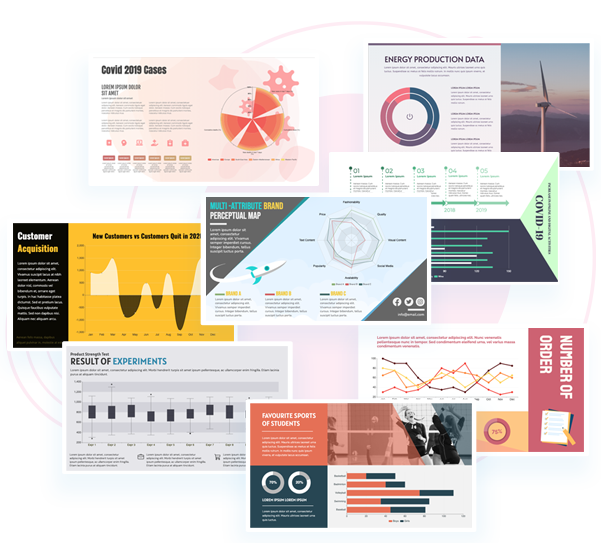
Over 50 professional types of charts to choose from
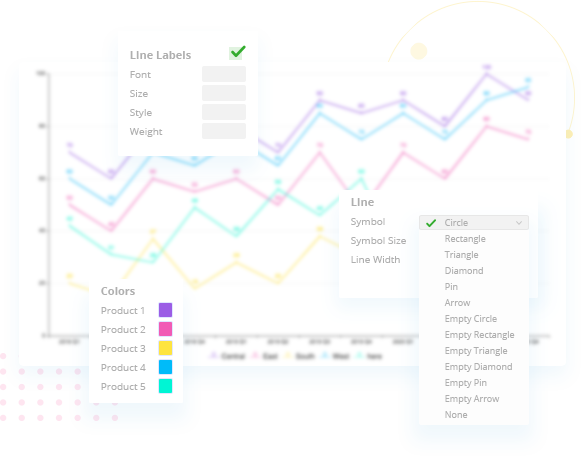
Apply effects to the bar chart to suit your brand and topic
Create beautiful bar chart with VP Online's bar chart builder in minutes. Start with a premade bar chart template designed by VP Online's world class design team. Quickly and easily customize any aspect of the bar chart. Publish and share the chart in few clicks.

Browse VP Online's library of premade Bar Chart template.
Open the template you like and click Edit to start customization it in our online bar chart maker.
Double click on the bar chart to open the spreadsheet data editor. Edit the data either by hand or by importing from Google Sheets.
Customize the chart. Edit its colors, fonts, spacing and other options under the Chart > Setting pane.
Optionally edit the background of the diagram. You can also add your own shapes and icons.
Tired of dull and boring chart design? Our world-class design team has designed a rich set of modern and creative bar chart templates to support your data visualization needs. Choose from one of our pre-designed bar chart templates and plug your data in. VP Online's bar chart creator makes data visualization hassle-free, giving you the freedom to customize your template as much or as little as you choose.
A bar graph or bar chart is a diagram for data visualization. It compares different values in a data set and presents the values as bars, with longer bars representing bigger numbers. When a bar chart is shown vertically, it becomes a column chart, or some people call that a vertical bar chart.
A bar chart is also known as a bar graph. It is one of the most widely used chart types for data visualization.
Visual Paradigm Online is the only graph maker you'll need to create all kinds of visual content, including bar chart, infographics, and more.
Design beautiful and professional infographics, flyers to cards, reports, social graphics, and more. Hundreds of content formats are available.
Create Your Chart Now


