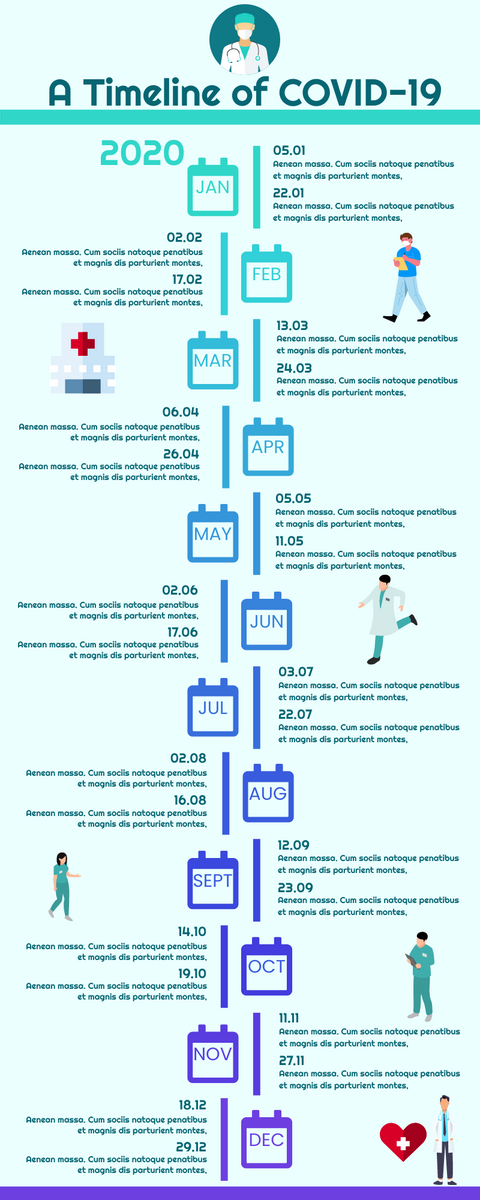
Timeline of COVID-19 Infographic
A timeline shows a list of events in chronological order. It is usually a graphic design that shows a strip chart with parallel dates, usually simultaneous events.
Timelines can use any appropriate scale to represent time, appropriate to the topic and data; Many people use a linear scale where the unit of distance is equal to a set amount of time.
This time scale depends on the events in the timeline. The timeline of evolution can stretch over millions of years, whereas the timeline of the day of the Sept. 11 attacks could stretch over minutes, and the timeline of the bombings could stretch over milliseconds.
Visual Paradigm Timeline Diagram
The Timeline Diagram tool of VP Online comes with a simple editor that lets you visualize timeline and roadmap effortlessly. It is so intuitive that allows you to pay more attention to the design itself without spending a lot of time on learning the software.
A large collection of free and customizable Timeline Diagram template is provided. Quickly get a head-start when creating your own Timeline Diagrams. Following are some of these templates.
Click Edit to start the infographic now. No registration needed!
There are many other timeline templates you can use, check here for more details


)")


