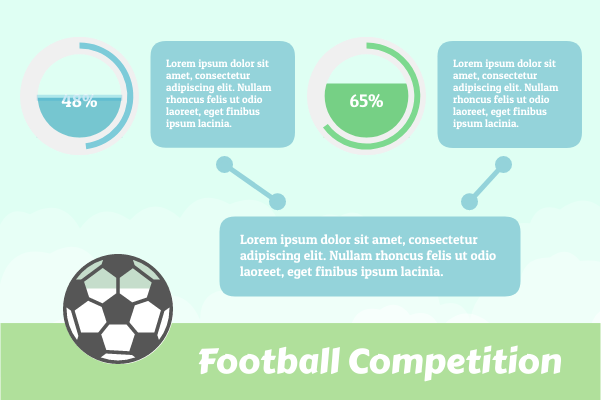
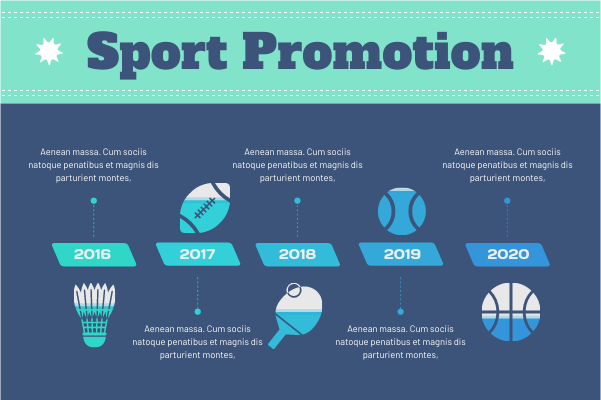
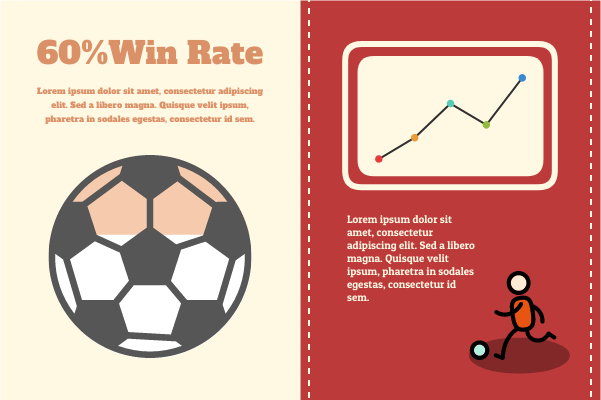
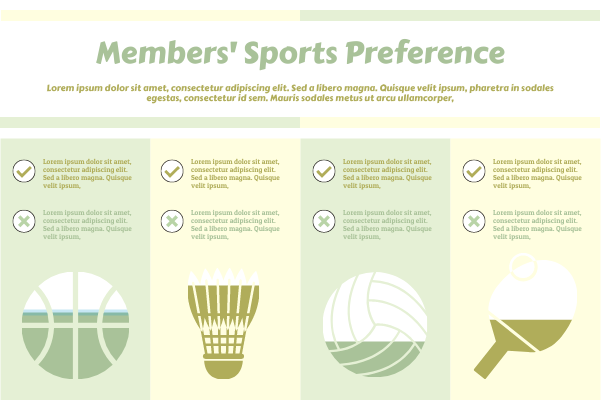
Create InfoChart to show your data visually. Visual Paradigm Online offers a wide varity of InfoChart objects to represent statistic and figures. Feel free to customize the widgets to fit your need. Change the color, font, etc. Let's have a try now!
Sport Template Specifications:
Customizable:
Here is a template that shows you how to use the InfoChart to create beautiful design. The template is designed by our world-class design team. It is completely customizable so that you can make any changes from the color and fonts to the placement of icons and background, etc.
Dominant Color
Palette
Dimension
600 x 400 px
