Easily create beautiful Venn Diagrams with web-based Venn Diagram software

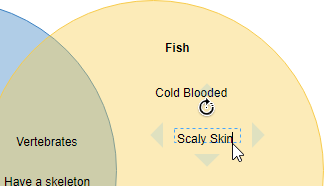
To add points into circles is simple. Simply double click within the boundary of a circle to create a text label, then enter the name, and that's it! This allows you to form a Venn Diagram quickly and easily.

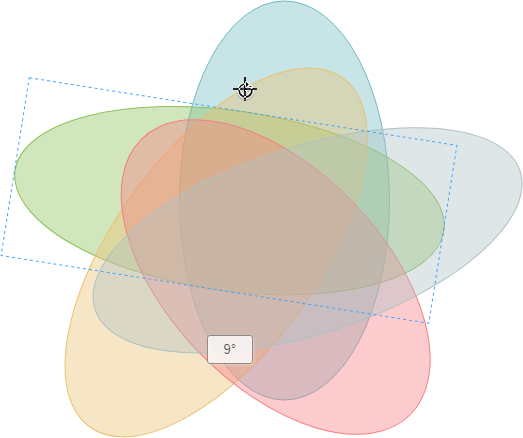
All the shapes inside a Venn Diagram can be rotated, moved and resized freely. This lets you to control the appearance of circles and points in a way that fit your context and helps convey the message that you want to deliver.

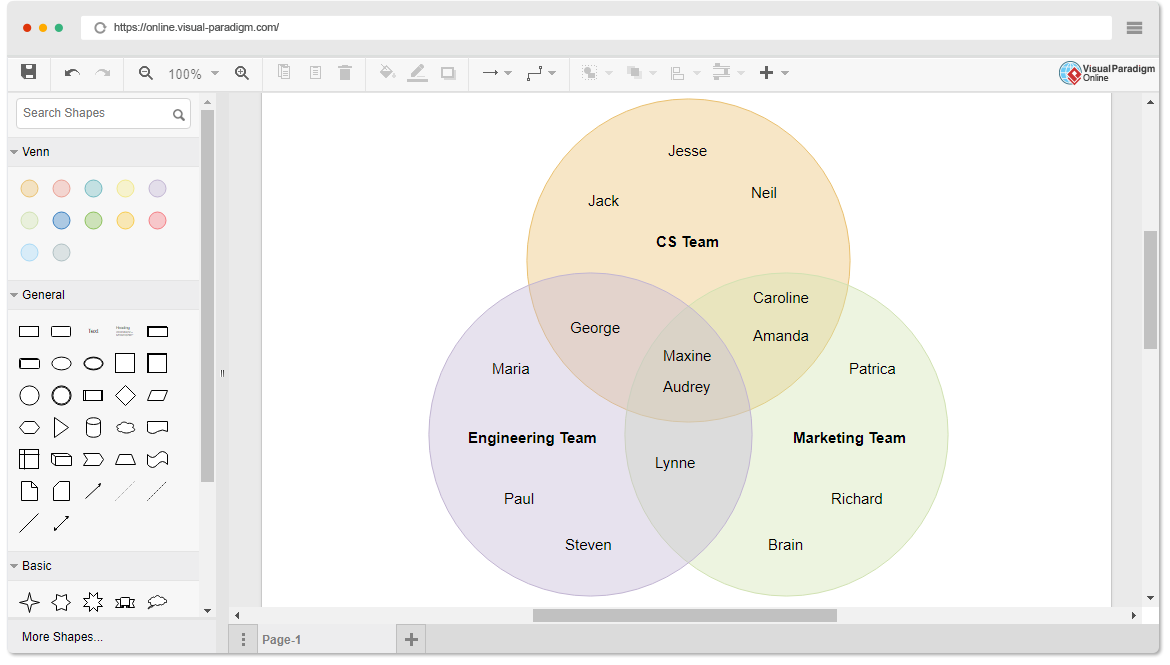
Venn Diagram, also called Primary Diagram, Logic Diagram or Set Diagram, is widely used in mathematics, statistics, logic, computer science and business analysis for representing the logical relationships between two or more sets of data. A Venn Diagram involves overlapping circles, which present how things are being organized, their commonality and differences. You can now draw Venn Diagram with Visual Paradigm's online Venn Diagram editor.
Need some inspiration? We've put together some Venn Diagram examples below to help you get started. Click on a diagram to view it, or click the edit button to start editing.
Looking for more? Good. VP Online has all the simple and advanced tools you need to draw venn diagram easily.
Create shapes and connectors with just one drag. Use alignment guide to position shapes precisely when dragging.
Instead of copying and pasting static images, embed interactive venn diagrams in MS applications. Word, PowerPoint, OneNote and Outlook are supported.
Use Visio stencils (.vssx, .vsdx) in your drawing through the import feature. Import your Visio drawing into VP Online and carry on editing.
Share your work with other by printing or exporting diagrams into images (PNG, JPG, SVG, GIF) or PDF.
Create a palette consisting of your stencils in image formats (e.g. SVG, JPG, PNG, etc) and use them in your design.
Team members can draw collaboratively and simultaneously. They can even edit on the same diagram without ruining others' work.
Create diagrams and charts in a simple and flexible way.