Deployment Diagram Tutorial
In the UML, you use class diagrams and component diagrams to reason about the structure of your software. You use sequence diagrams, collaboration diagrams, statechart diagrams, and activity diagrams to specify the behavior of your software. At the edge of your system's software and hardware, you use deployment diagrams to reason about the topology of processors and devices on which your software executes.
What is a Deployment Diagram in UML?
In the UML, deployment diagrams is used to visualize the static aspect of these physical nodes and their relationships and to specify their details for construction.
Deployment diagrams are one of the two kinds of diagrams used in modeling the physical aspects of an object-oriented system. A deployment diagram shows the configuration of run time processing nodes and the components that live on them. Deployment diagrams address the static deployment view of an architecture. They are related to component diagrams in that a node typically encloses one or more components.
Class vs Node vs Component
Component diagrams and deployment diagrams are similar to class diagrams, except that instead of containing classes, they contain components and nodes, respectively. Deployment diagrams are essentially class diagrams that focus on a system's nodes. You use deployment diagrams to model the static deployment view of a system. For the most part, this involves modeling the topology of the hardware on which your system executes.
We typically use classes to model the concepts and things in a problem domain, and subsequently, we can model them with concrete instances using components and nodes. For example, if you want to model the topology of your organization's network, you'll use deployment diagrams containing instances of nodes. Similarly, if you want to model the components that live on the physical nodes in this network, you'll use component diagrams containing instances of the components.
Try it!
Finding an online Deployment Diagram tool? Just click the Draw button below to create your Deployment Diagram online. Visual Paradigm Online is free* and intuitive. You can also go through this Deployment Diagram tutorial to learn about Deployment Diagram before you get started.
Draw NowDeployment Diagram Notations
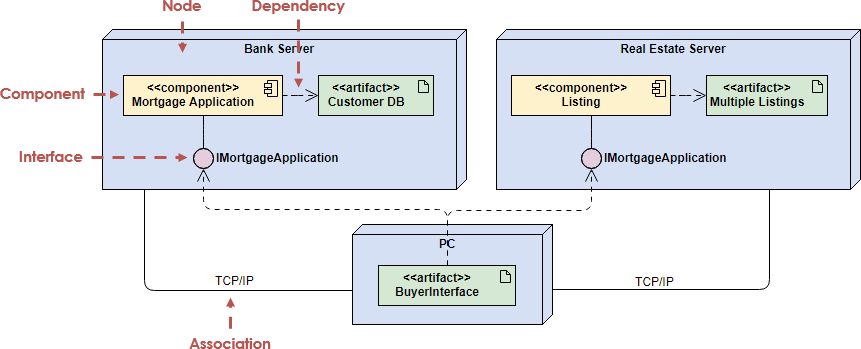
Component
A component is a grouping of classes that work together closely. Components can be classified by their type. Some components exist only at compile time, some exist only at link time, some exist only at run time; and some exist at more than one time.
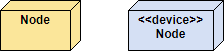
Node
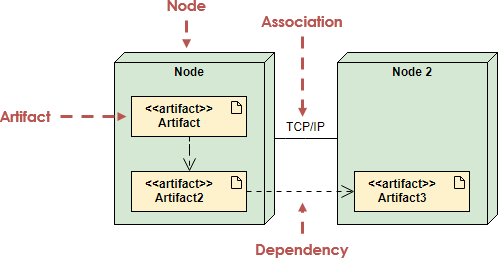
A node is a run-time physical object that represents a computational resource, generally having memory and processing capability. You can model node types and node instances. You may model the component instances that run or live on a node by drawing them within the node. You may model which nodes communicate with one another using the Connection relationship line.
Dependency
A dependency indicates that one model element (source) depends on another model element (target), such that a change to the target element may require a change to the source element in the dependency. In a deployment diagram, you can use the dependency relationship to show the capability of a node type to support a component type. You may also use the relationship to show the dependency between component types.
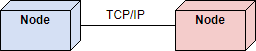
Connection
A connection depicts the communication path used by the hardware to communicate usually indicates the method i.e. TCP/IP.
Artifact
Artifacts represent concrete elements in the physical world that are the result of a development process. Examples of artifacts are executable files, libraries, archives, database schemas, configuration files, etc.
When to Draw Deployment Diagram?
When you model the static deployment view of a system, you'll typically use deployment diagrams in one of three ways.
- To model embedded systems
- A collection of hardware that interfaces with the physical world.
- A set of controls devices such as motors, actuators, and displays.
- A set of external stimuli such as sensor input, movement, and temperature changes.
- You can use deployment diagrams to model the devices and processors that comprise an embedded system.
- To model client/server systems
- A client/server system is a common architecture focused on making a clear separation of concerns between the system's user interface (which lives on the client) and the system's persistent data (which lives on the server).
- A Client/server systems are about the physical distribution of your system's software components across the nodes.
- You can model the topology of such systems by using deployment diagrams.
- To model fully distributed systems
- A distributed systems are often hosts to multiple versions of software components, some of which may even migrate from node to node.
- A distributed systems requires you to make decisions that enable the continuous change in the system's topology.
- You can use deployment diagrams to visualize the system's current topology and distribution of components to reason about the impact of changes on that topology.
How to Draw a Deployment Diagram?
A Deployment model can be developed by following the steps below.
- Firstly, identify the nodes that represent your system's client and server processors and then highlight those devices that are relevant to the behavior of your system.
For example, you'll want to model special devices, such as credit card readers, badge readers, and display devices other than monitors, because their placement in the system's hardware topology are likely to be architecturally significant. - Provide visual cues for these processors and devices via stereotyping.
- Model the topology of these nodes in a deployment diagram.
- Similarly, specify the relationship between the components in your system's implementation view and the nodes in your system's deployment view.
Deployment Planning
A Deployment model can be developed by following the steps below.
- Design and plan how will your system be installed?
- Determine if different versions of the system will be deployed at the same time, how will you resolve differences?
- What physical sites do you need to deploy to and in what order?
- How will you train your users?
- What backups do you need before installation?
Deployment Diagram Examples
A component is a code module. Component diagrams are physical analogs of class diagram. Deployment diagrams show the physical configurations of software and hardware. The following deployment diagram shows the relationships among software and hardware components involved in real estate transactions.
The physical hardware is made up of nodes. Each component belongs on a node. Components are shown as rectangles with two tabs at the upper left.
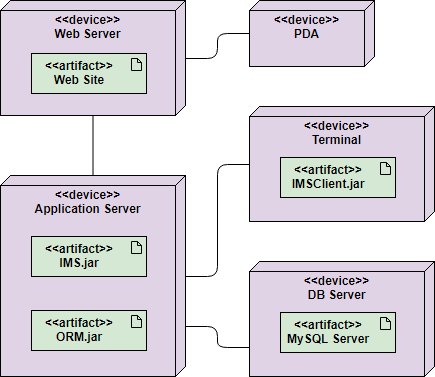
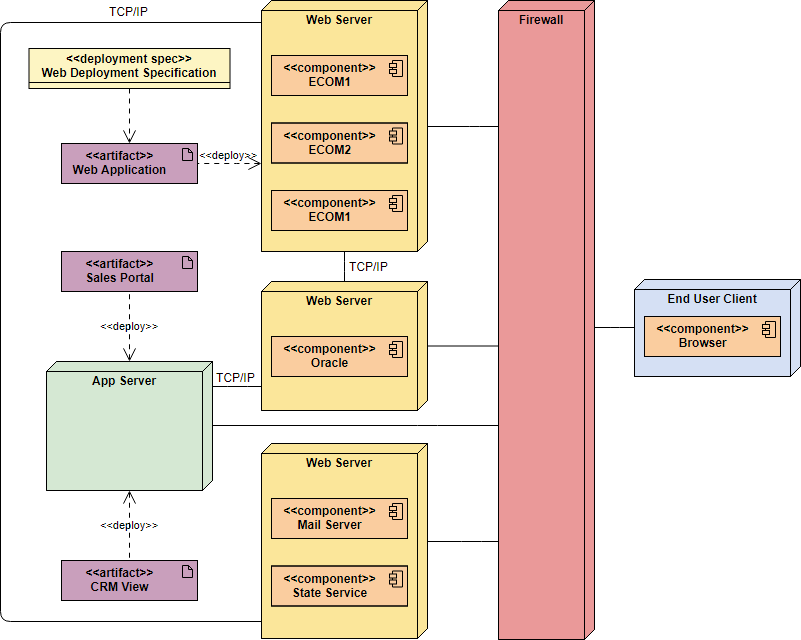
The Deployment Diagram example below shows a Management Information System for a SME which use TCP/IP as network communication protocol for connecting between the web server database, application, email servers and etc. protected by a firewall between the client and server side of the system.
More Class Diagram examples:
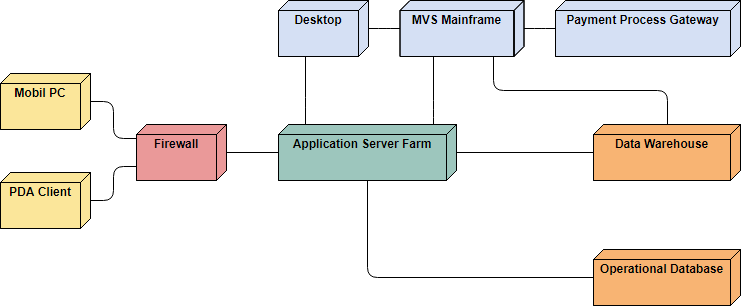
Deployment Diagram Example - Corporate Distributed System
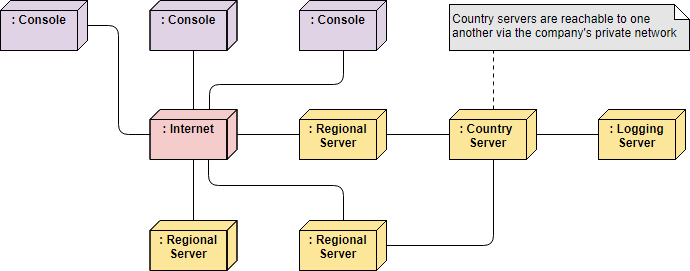
Deployment Diagram Example - Modeling a Distributed System
Want to draw a Deployment Diagram?
You've learned what a Deployment Diagram is and how to draw a Deployment Diagram step-by-step. It's time to get your hands dirty by drawing a Deployment Diagram of your own. Draw UML diagrams free* with Visual Paradigm Online. It's easy-to-use, intuitive.
Draw Now* The Free edition supports free usage of Visual Paradigm Online for non-commercial use only.