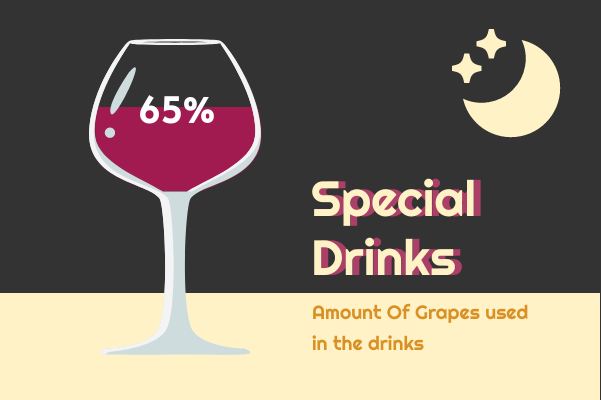
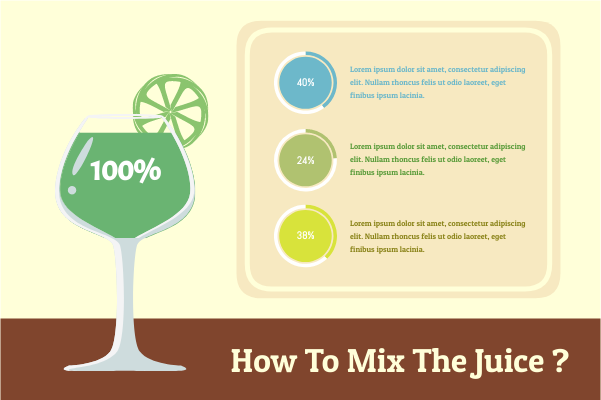
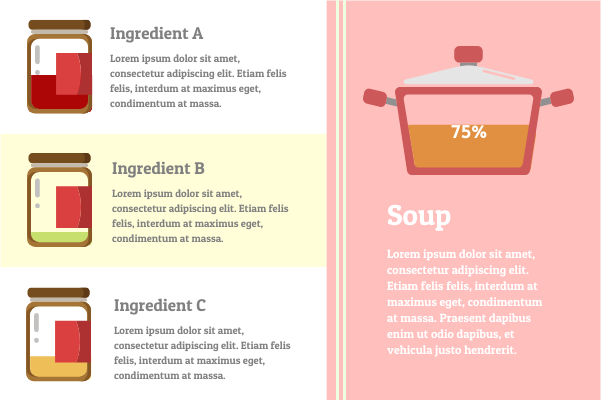
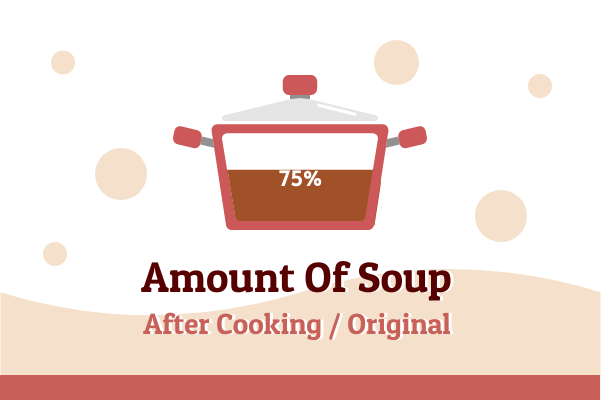
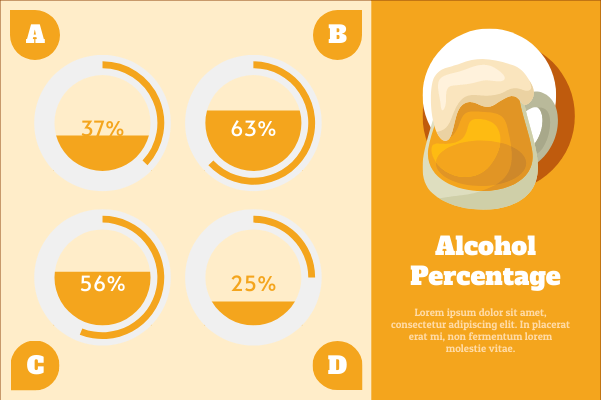
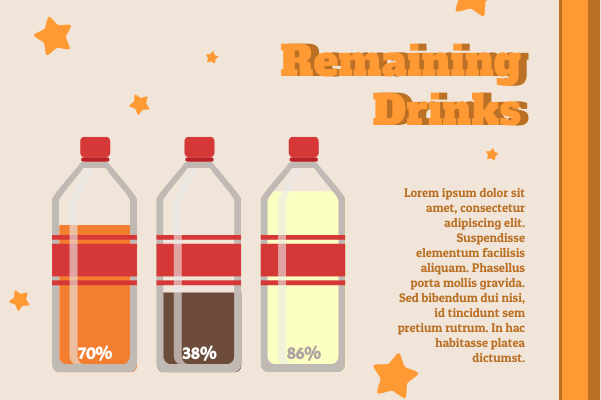
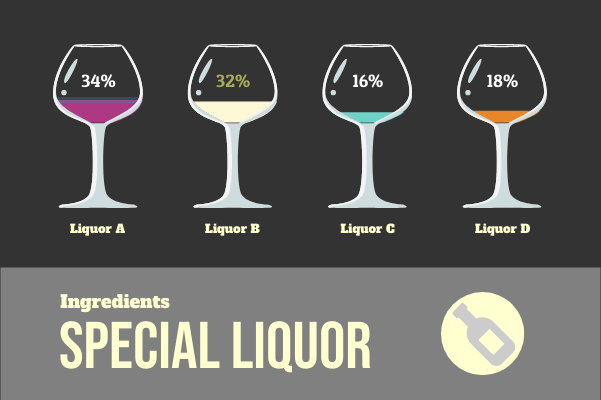
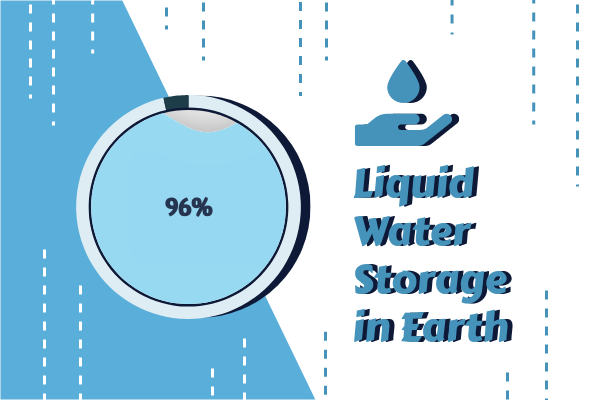
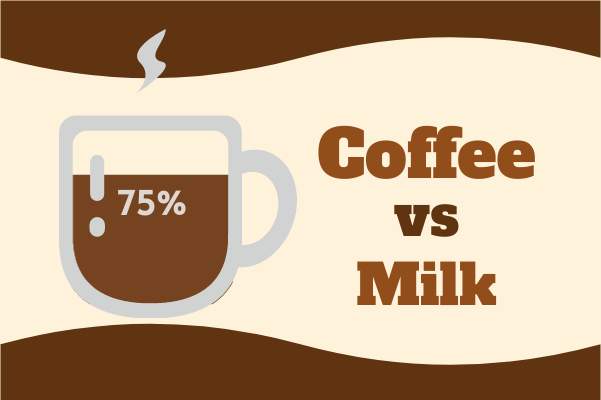
Create InfoChart to show your data visually. Visual Paradigm Online offers a wide varity of InfoChart objects to represent statistic and figures. Feel free to customize the widgets to fit your need. Change the color, font, etc. Let's have a try now!
Container Template Specifications:
Customizable:
Here is a template that shows you how to use the InfoChart to create beautiful design. Simply click on the Edit button to get started. Edit the chart data, touch-up the color and font to complete it. Get things done in minutes.
Dominant Color
Palette
Dimension
600 x 400 px
