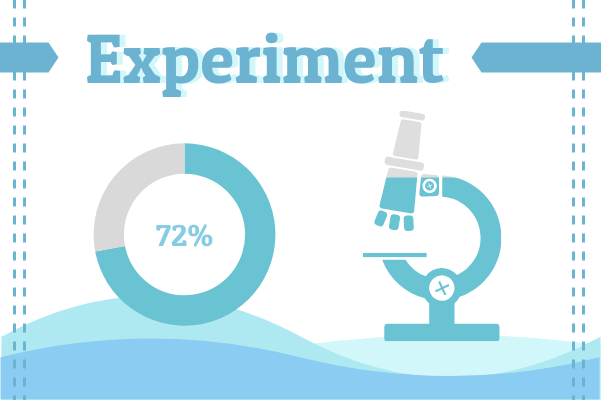
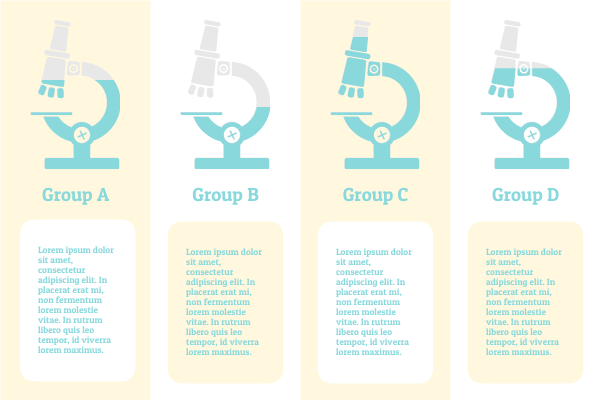
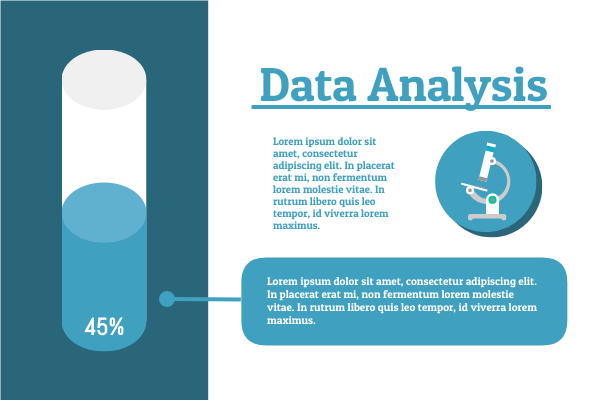
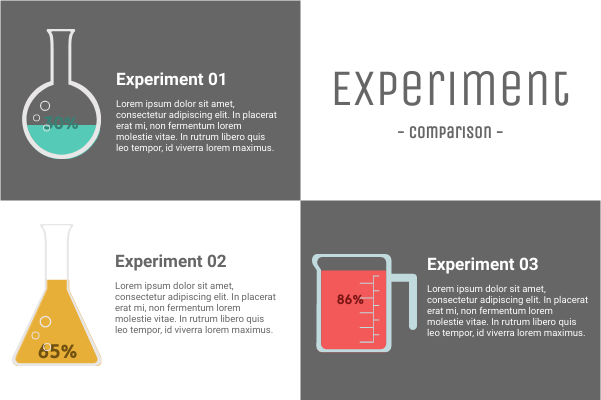
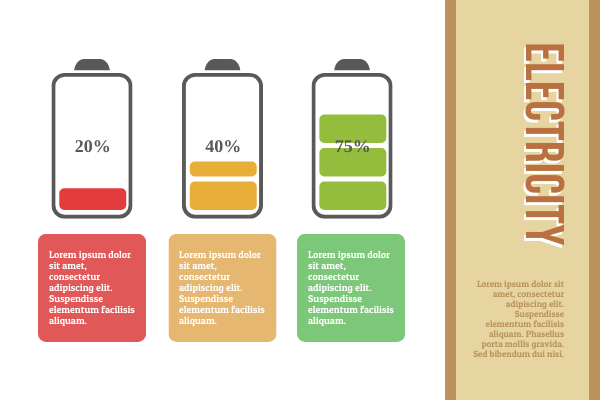
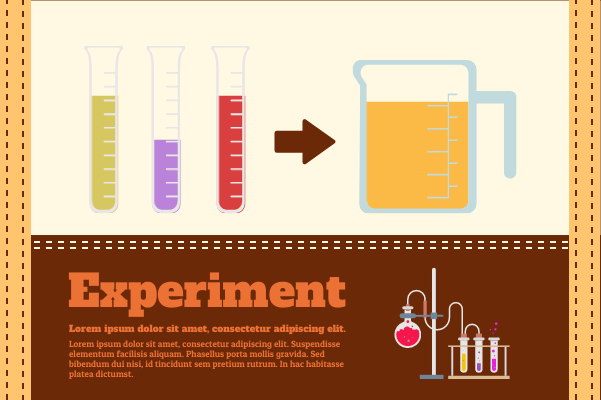
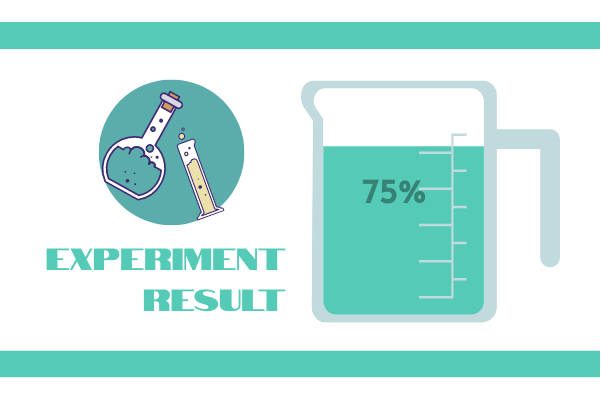
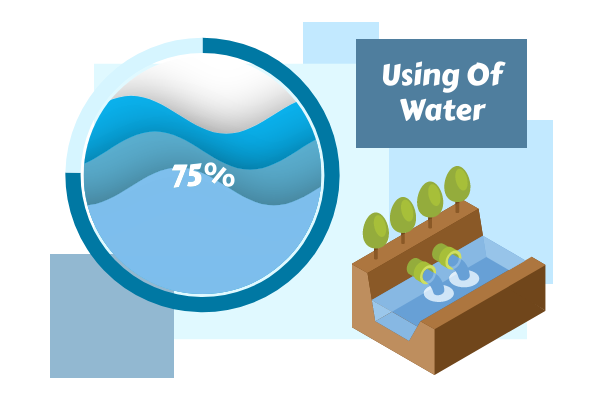
Visual Paradigm Online allows you to create beautiful visuals easily. InfoChart, one of its design feature, provides you with a large set of interactive components for data visualization. You can include InfoChart in your infographic, presentations and other visual, and tweak the value through drag-and-drop.
Laboratory Template Specifications:
Customizable:
Here is a template that shows you how to use the InfoChart to create beautiful design. The template is designed by our world-class design team. It is completely customizable so that you can make any changes from the color and fonts to the placement of icons and background, etc.
Dominant Color
Palette
Dimension
600 x 400 px
