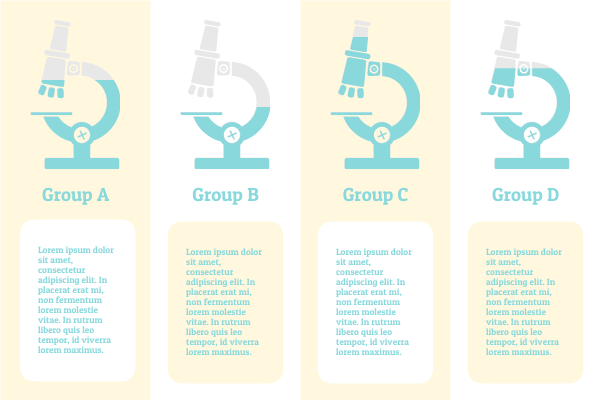
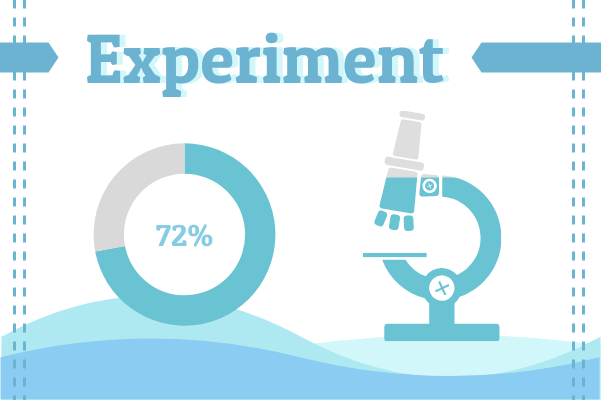
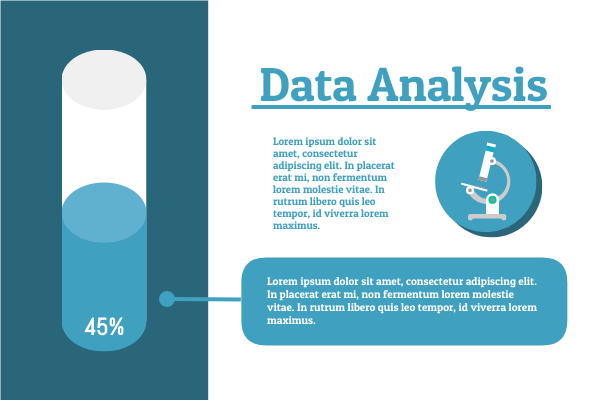
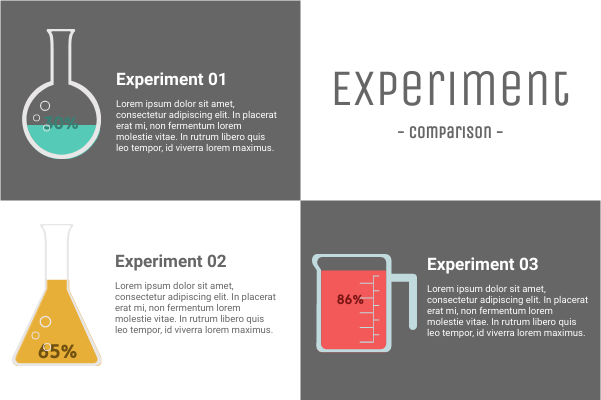
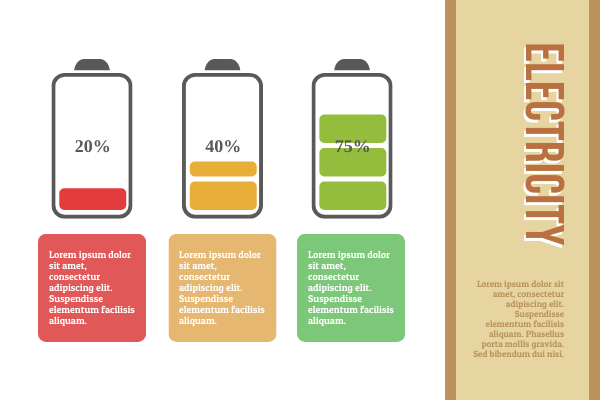
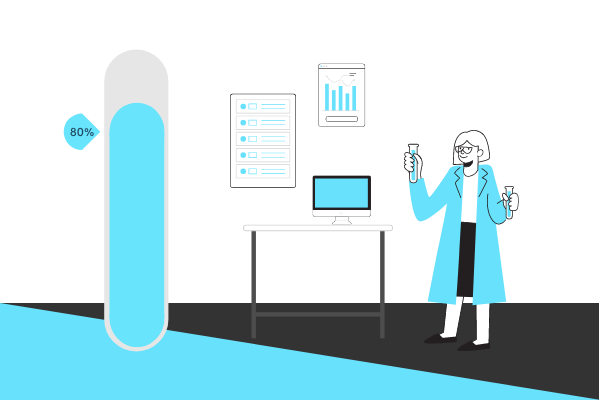
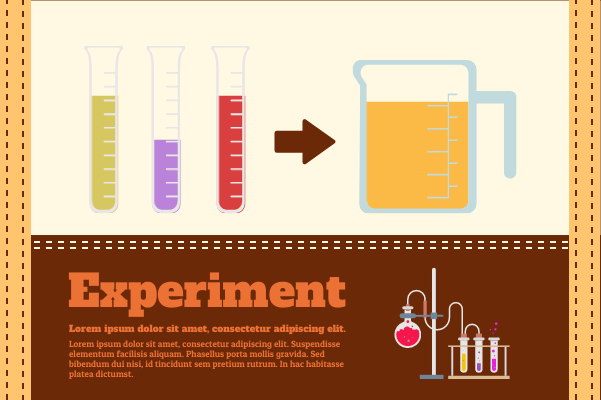
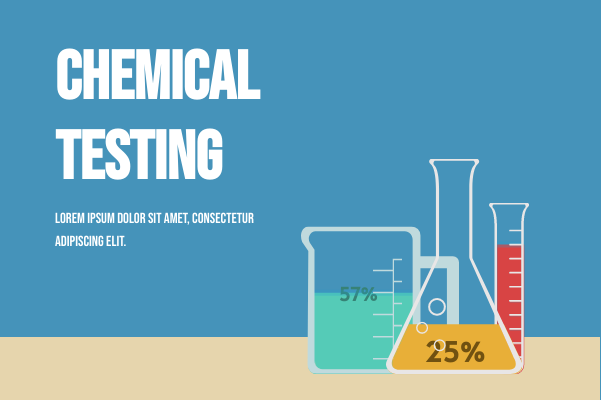
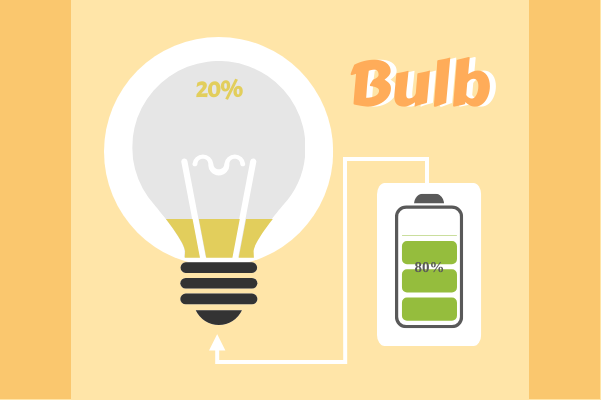
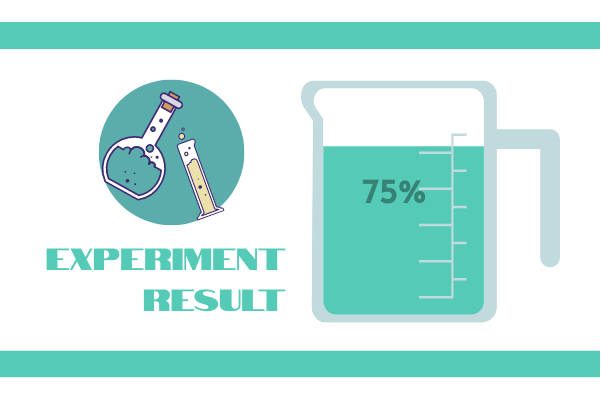
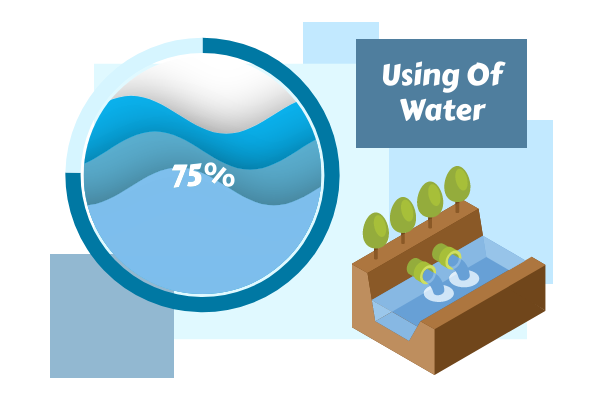
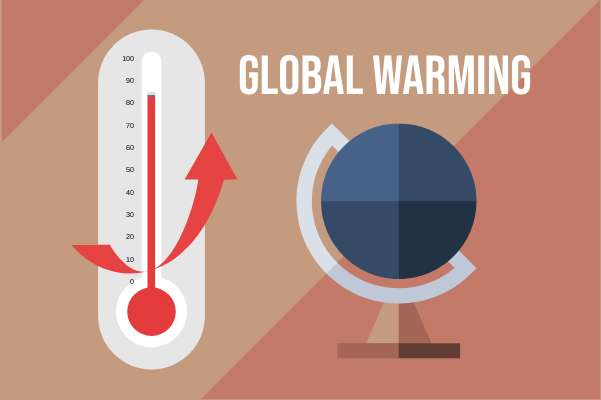
Data visualization is important in infographics and presentation. With Visual Paradigm's InfoChart, you can presents statistic and figures with beautiful data widgets. A wide variety of widgets are supported, covering use cases like progress, container, clock, etc.
Laboratory Template Specifications:
Customizable:
Here is a template that shows you how to use the InfoChart to create beautiful design. Get a head start with this beautiful template. Customize it to suit your needs and make your design stand out. Click Edit to get started. Replace your own data and touch-up the design by editing the background, color and font. Get an amazing design done in minutes.
Dominant Color
Palette
Dimension
600 x 400 px
