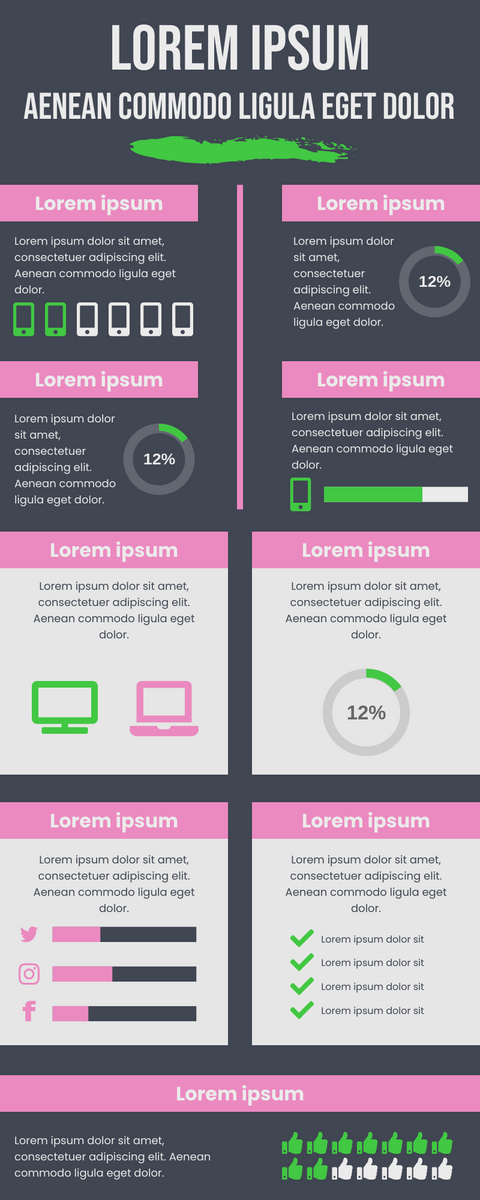
Digital Data Presentation Infographic
In the digital world, people's demand for information visualization is increasing day by day. Information visualization is the manifestation of information visualization. You can create any charts you like: line, bar, doughnut, pie, radar, bubble, rose, heatmap, etc. Just enter your data to get instant results. You can also switch between chart types without losing your data.
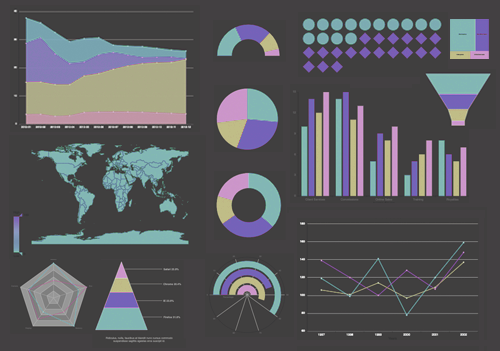
Using charts to display data on specific occasions and intuitively express information can not only save the overwhelming text, but also display it more clearly and intuitively, turn mediocrity into magic, and let anyone have the desire to seriously examine.
So just share a few simple and powerful online spreadsheet apps in a few days, and you can increase your productivity. You can now create professional infographic people will love to read in just minutes by using the pre-made templates.


