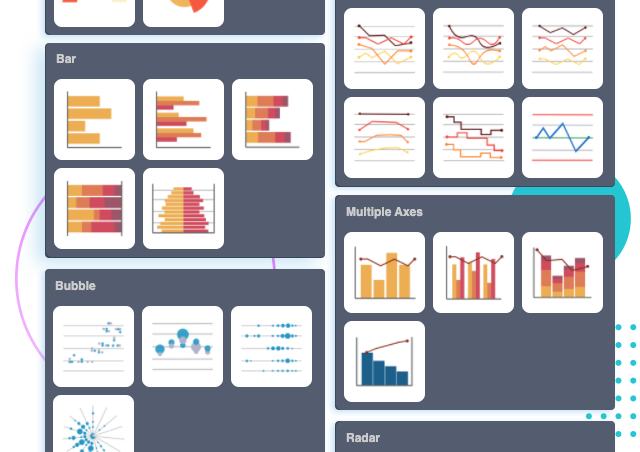
50+ chart types
Choose from over 50 chart types to find the perfect representation of your data. Both common and advanced chart types are supported, including bar, line, area, pie, doughnut, radar, and rose charts.
Visualize your data and statistics quickly and easily with Visual Paradigm's online chart maker.
Choose from over 50 chart types to find the perfect representation of your data. Both common and advanced chart types are supported, including bar, line, area, pie, doughnut, radar, and rose charts.

Visual Paradigm Online offers a wide range of chart templates to help you design beautiful and professional infographics, posters, presentations, reports and more. Just replace the text and the chart data, and then you will obtain a nice creation that is ready to be published and shared.
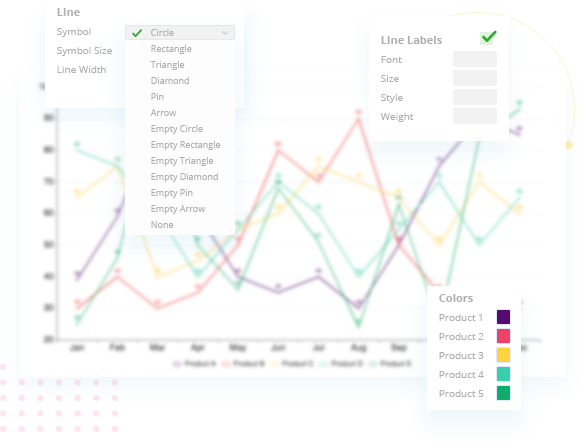
Creating professional charts online is easier than ever with our online chart maker. Customize your chart to match your company's brand colors and fonts or choose the color that matches your topic. Customize everything, from the fonts and colors to position of titles and legends in a few clicks.

You’ve perfected your chart—what if you could publish it as a stunning, interactive web page in just a few clicks? Now you can. We’ve integrated two powerful new features, Pipeline and Display Hall, to create a seamless workflow from creation to showcase.
Forget about downloading, exporting, and uploading files. This integrated system handles the entire journey, letting you focus on telling the story behind your data.
With Pipeline as the bridge and Display Hall as the stage, you now have an end-to-end solution to not only visualize your data but to present it with style and impact.