An Affinity Diagram is a tool that is used to organize ideas, opinions, and issues and sort them into groups, based on their natural relationships. Affinity diagram provides a visual presentation of a grouping of a large number of related items or data to help in organizing action plans. They come in very handy when you are confronted with many facts or ideas in apparent chaos, and when issues seem too large and complex to grasp.
Affinity diagram can be used to engage each individual within a team, foster collaboration, and improve the ability of the team to address complex issues. An affinity diagram is a simple tool that allows a team to:
- Generate ideas about a situation or problem
- Help in the identification of primary themes in a set of ideas.
- Simplify large, complex issues into a format that is easier to manage and understand.
- Communicate their ideas in a simple and powerful representation
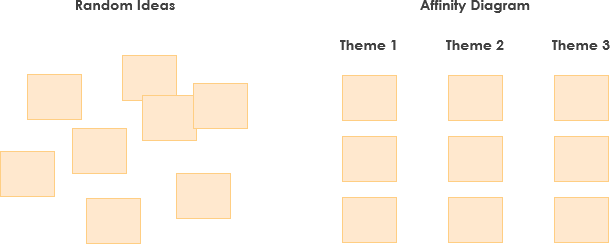
From Random Ideas to Orderly Taxonomy
As part of the process, a group of individuals reviews a bunch of ideas generated from brainstorming. After this, they place these ideas into related and meaningful categories called affinity sets. These categories tie different concepts together with one underlying theme. This way the newly formed groups of ideas can be analyzed and prioritized before being implemented.
How do I use an Affinity Diagram?
The Affinity Diagram is an alternative to brainstorming that is particularly useful when: the problem is too large or too complex to be handled by a simple and non-hierarchical group of the brainstorming session. The Affinity Analysis session is typically conducted by the following steps:
- Generate ideas. Collect and record the ideas, suggestions, and opinions of each team member on sticky notes. Team members should only write one idea/suggestion/opinion per sticky note and should be encouraged to create at least five sticky notes.
- Display ideas. Post everybody’s sticky notes on a wall.
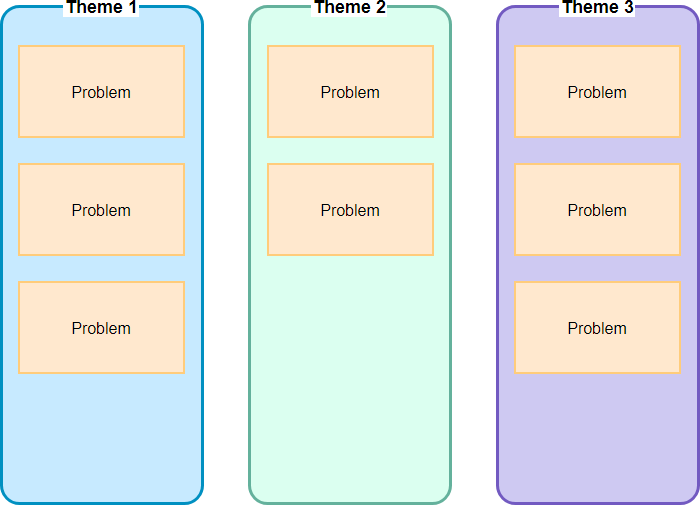
- Sort the ideas into related groups. Ask all team members to come to the wall and quietly look for ideas/suggestions/opinions that seem to be related
- Create header cards for the groups. Ask team members to sort the related sticky notes into groups
- Draw the finished Affinity Diagram. Ask a team member to write the titles of each group on different colored sticky notes, which will be the team’s Affinity Diagram Titles and document the finished Affinity Diagram
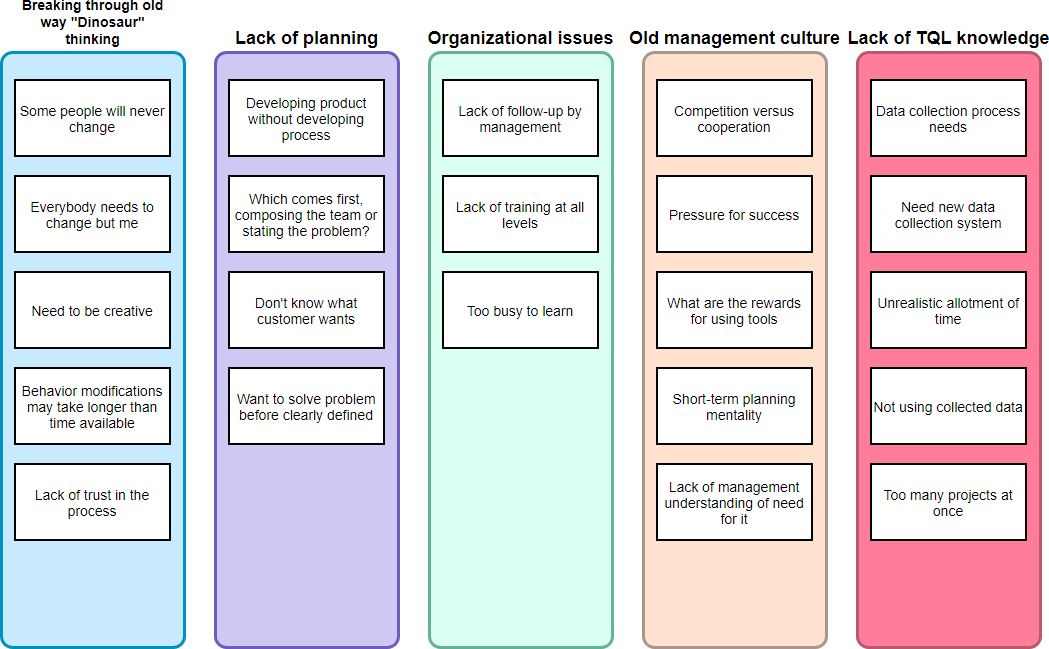
Affinity Diagram Example – Implementing Continuous Process Improvement