What is a flowchart?
A flowchart is a pictorial representation depicting the flow of steps in a program or business process in an organization. A flowchart can often be used to show the program structure, logic flow and operations performed that forms an important part of the documentation of the system; and subsequently, it enables us to trace and detect any logical or other errors before the programs are written. Besides, flowcharts are used by system and business analysts to show various processes, subsystems, outputs and operations of a system.
The Elements of Flowchart
Elements are represented by simple icons (circles, rectangles, diamonds, or other shapes), with lines and arrows representing connections between events and the direction or order in which they occur. A flowchart indicates sequences and decision points as well as starting and stopping points. Since it is easier to grasp relationships in a visual form than in verbal description, flowcharts can prevent the omission of steps in a process.
| Element | Description | Symbol |
| START / STOP terminator | START and one STOP terminator in your entire flowchart. In case a program logic involves a pause, it is also indicated with the terminal symbol. | 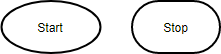 |
| Input / Output | This symbol is used to denote any input/output function in the program. Thus if there is any input to the program via an input device, like a keyboard, tape, card reader, etc. it will be indicated in the flowchart with the help of the Input/Output symbol. Similarly, all output instructions, for output to devices like printers, plotters, magnetic tapes, disk, monitors, etc. are indicated in the Input/Output symbol. |  |
| Decision | Represents a decision point in the process, usually requiring a `yes’ or `no’ response, then branching to different parts of the flowchart. |  |
| On/Off Page Reference. | Represents a connection with another process. | 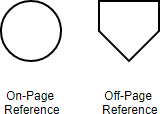 |
| Flow Lines | Indicates the direction of flow. Horizontal arrows depict procedures or linear sequence of events, and vertical arrows depict sub- or superordinate skills and knowledge. | |
| Process | A process symbol is used to represent arithmetic and data movement instructions in the flowchart. All arithmetic processes of addition, subtraction, multiplication, and division are indicated in the process symbol. The logical process of data movement from one memory location to another is also represented in the process box. |  |
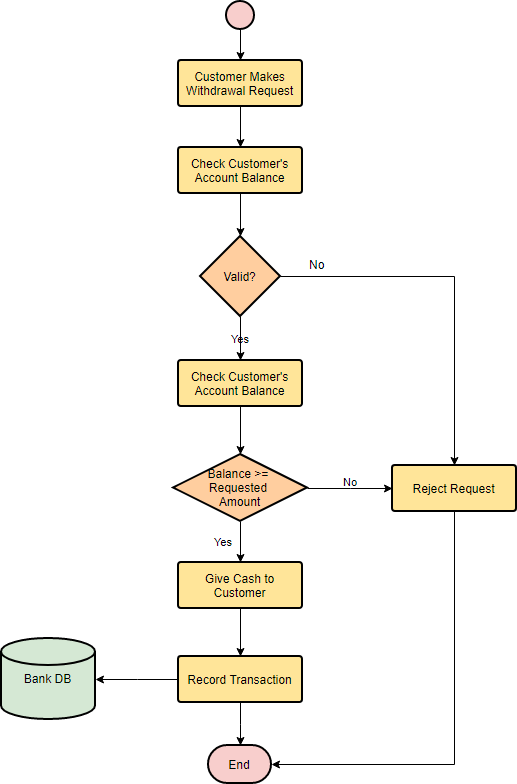
Flowchart Example – Withdraw Cash in ATM Machine
This generic ATM flowchart example shows what a cash withdrawal process might look like. Using a flowchart to layout out the steps involved in withdrawing cash helps you recognize the steps involved, the decision points and when would the communication with the bank takes place.
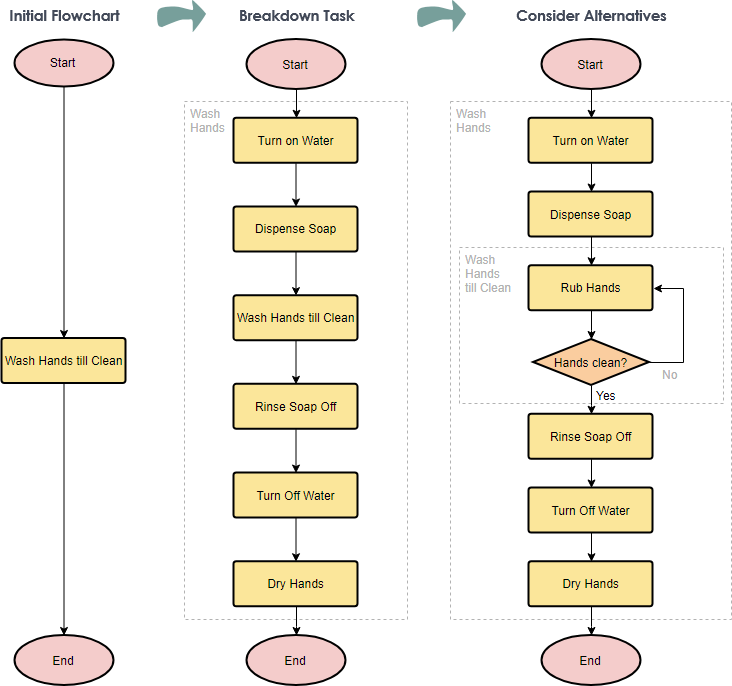
Creating a Flowchart through Stepwise Refinement
The most effective way to solve a complex problem is to break it down into successively simpler sub-problems. You start by breaking the whole task down into simpler parts. Some of those tasks may themselves need subdivision. This process is called stepwise refinement (or known as top-down decomposition). You can following the steps to create a flowchart with the stepwise refinement technique:
- How do you get from a complex task to an organized flowchart describing how to do it?
- Start with a flowchart containing just the task.
- Now break it down into smaller, more specific steps in another flowchart.
- Then, consider any possible exception in the flow, if so, add a decision node for the alternative paths.
- Keep on repeating this process until you’ve reached steps that are simple enough for everyone to fully understand it.