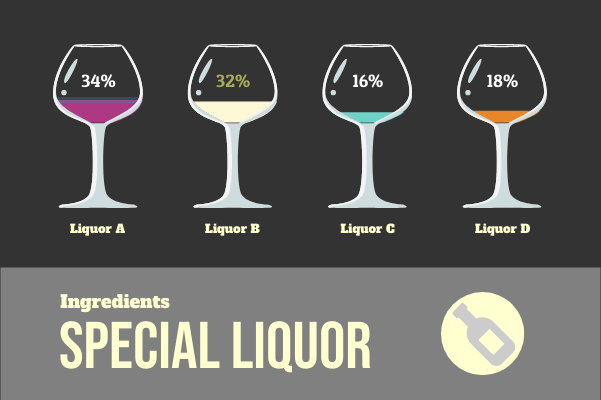
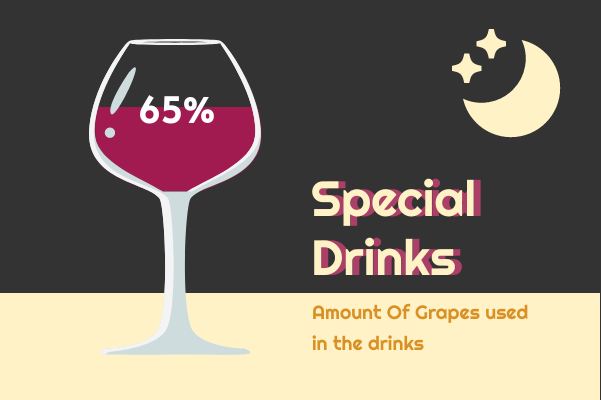
Visual Paradigm Online allows you to create beautiful visuals easily. InfoChart, one of its design feature, provides you with a large set of interactive components for data visualization. You can include InfoChart in your infographic, presentations and other visual, and tweak the value through drag-and-drop.
Container Template Specifications:
Customizable:
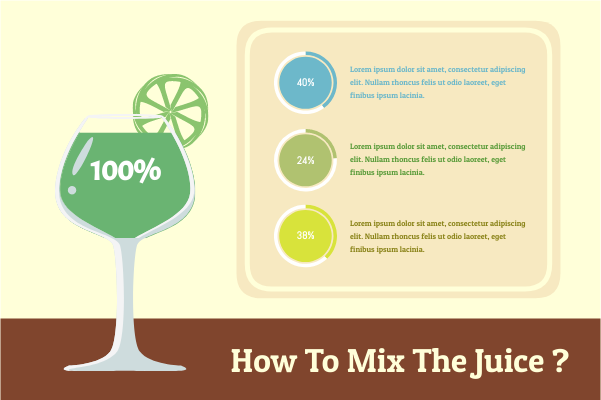
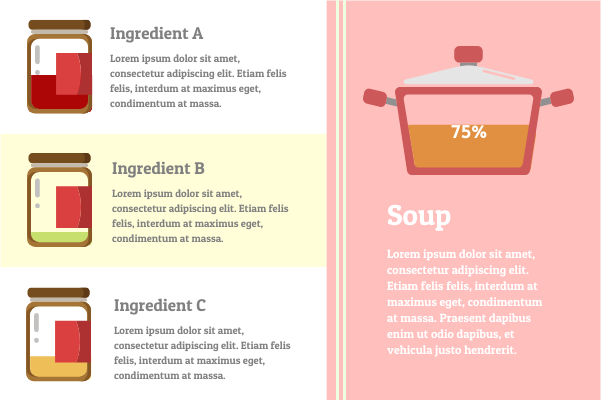
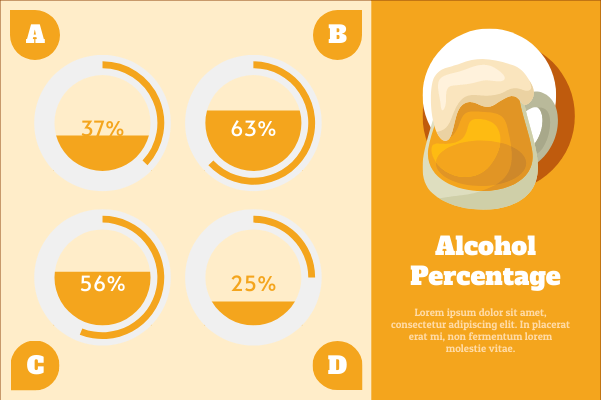
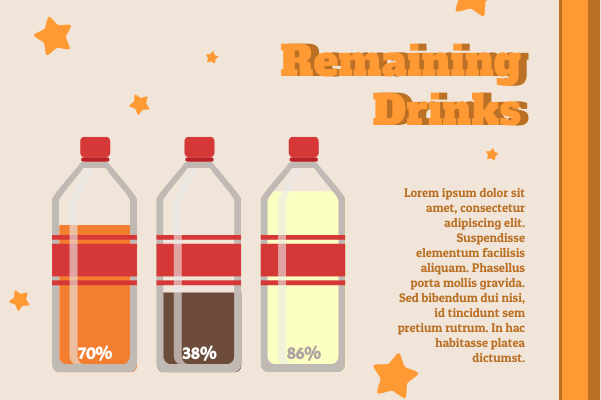
Here is a template that shows you how to use the InfoChart to create beautiful design. Get a head start with this beautiful template. Customize it to suit your needs and make your design stand out. Click Edit to get started. Replace your own data and touch-up the design by editing the background, color and font. Get an amazing design done in minutes.
Dominant Color
Palette
Dimension
600 x 400 px
