InfoChart are content widgets designed for data visualization. You can include InfoChart in your presentation, infographic and other design, and adjust data easily through simple drag-and-drop.
Progress Template Specifications:
Customizable:
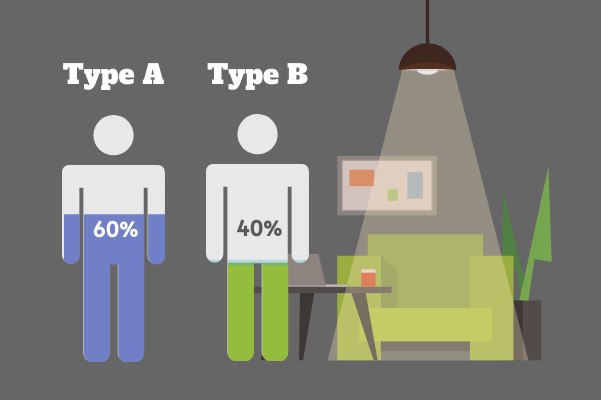
Present data in a visually appealing and comprehensive way using InfoChart widgets. Replace the data with your own. Tailor the design to suit your needs by modifying the background, color and font. You can also add additional icons, photos and text blocks to complement your message.
Dominant Color
Palette
Dimension
600 x 400 px


