Charts are a great tool for communicating information in visual manner. With Visual Paradigm's chart maker, you can easily design and share your own charts online. We support a wide variety of different chart types like: histograms, pie charts, area charts, line charts, bubble charts and radar charts.
Histograms Template Specifications:
Customizable:
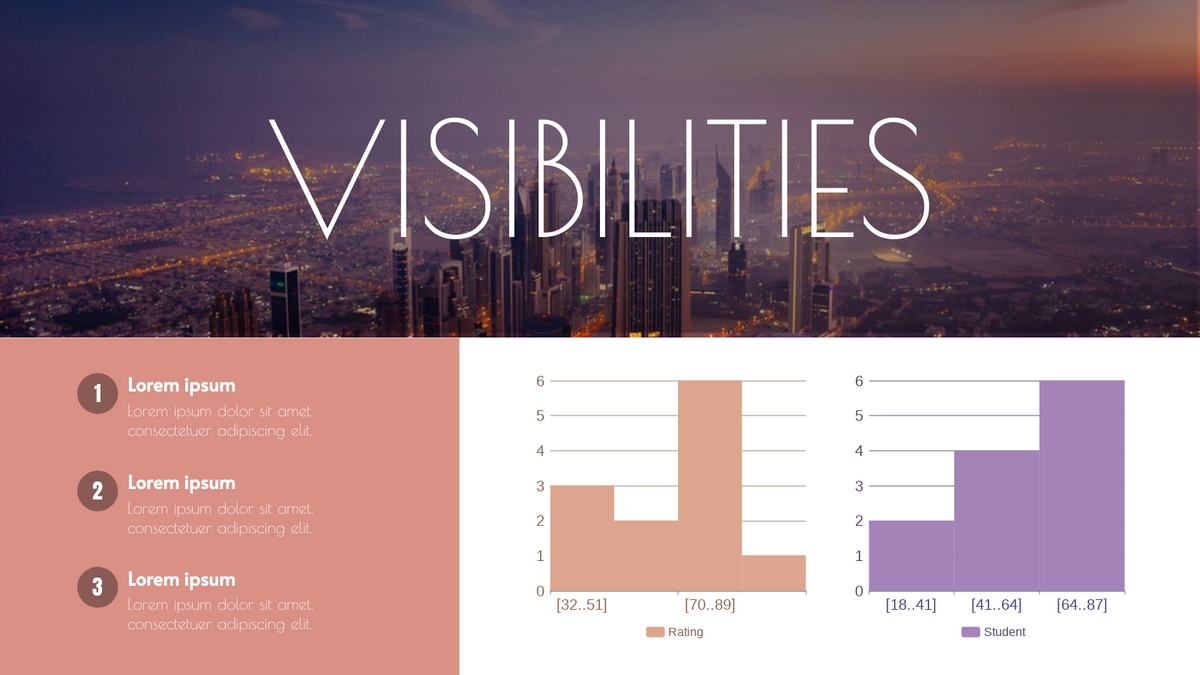
Need to create a histogram? Get a head start with this beautiful histogram templates. Click on the Edit button to begin, edit the data, and customize anything from the color and fonts to the placement of icons and background. Our histogram templates are perfect for those who want to create an impressive histogram for a presentation or report.
Dominant Color
Palette
Dimension
1600 x 900 px


