Data visualization is important in infographics and presentation. With Visual Paradigm's InfoChart, you can presents statistic and figures with beautiful data widgets. A wide variety of widgets are supported, covering use cases like progress, container, clock, etc.
Business Template Specifications:
Customizable:
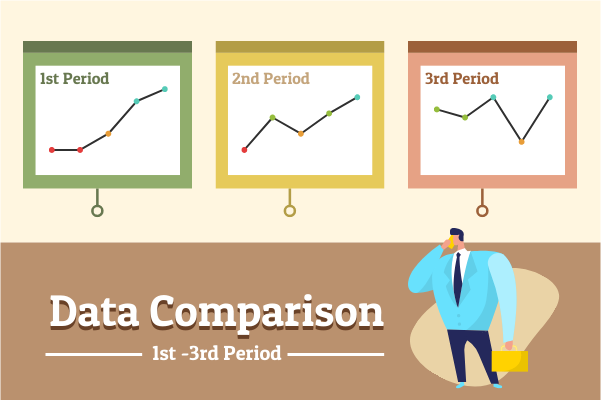
Here is a template that shows you how to use the InfoChart to create beautiful design. Click Edit to get started. Replace your own data and personalize the design by modifying the background image, the color and font. We features an unbeatable collection of high-quality stock photos to support your design needs.
Dominant Color
Palette
Dimension
600 x 400 px


