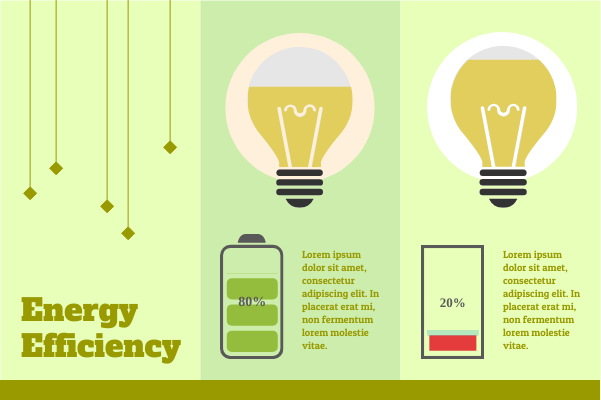
Data visualization is important in infographics and presentation. With Visual Paradigm's InfoChart, you can presents statistic and figures with beautiful data widgets. A wide variety of widgets are supported, covering use cases like progress, container, clock, etc.
Technology Template Specifications:
Customizable:
Present data in an intellectual and attractive way. Here is a template that shows you how to use the InfoChart to create beautiful design. Simply click the Edit button below to begin. Edit your data, customize the color, font, image(s), etc. The easy-to-use infographic maker helps you create amazing design in minutes.
Dominant Color
Palette
Dimension
600 x 400 px