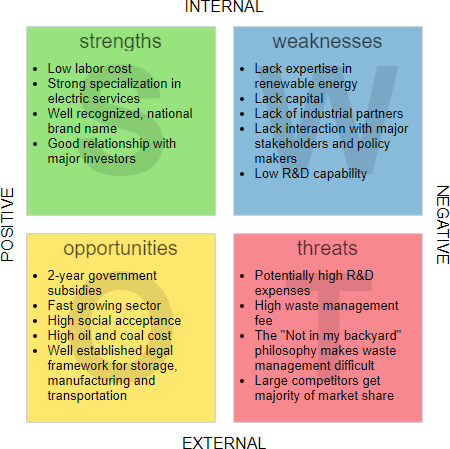
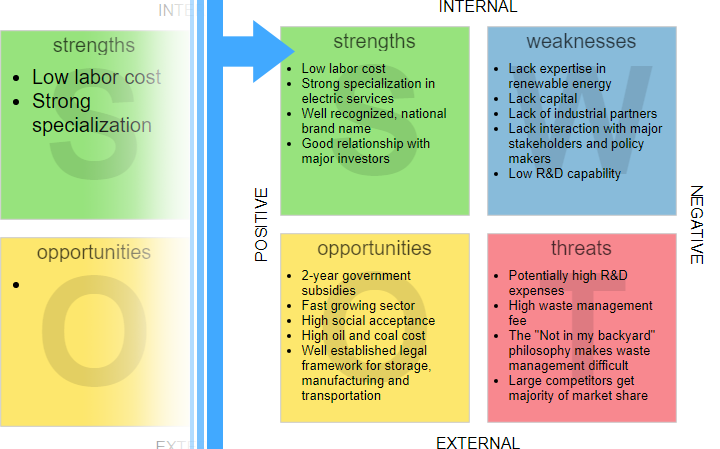
SWOT Analysis Diagram
SWOT (Strength, Weakness, Opportunities, and Threats) is made of two parts: the strengths and weaknesses refer to the internals of a company while the opportunities and threats are external to the company and exist in the environment. SWOT analysis is an easy, yet powerful business strategy tool that helps planners be realistic about what they can achieve, and where they should focus.
Our online SWOT Analysis tool allows you to easily and quickly develop a SWOT model by using an intuitive list-based data editor. Now, you can focus on the brainstorming process by listing out the information in bullet points for auto formatting / layout and super easy updating / modifications
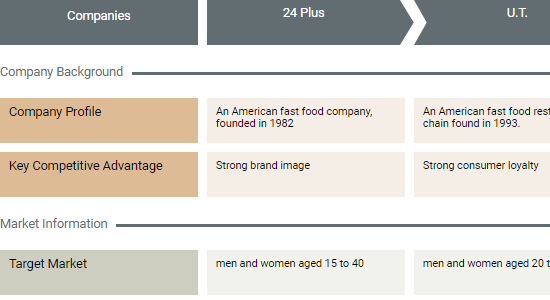
Competitor Analysis
Getting to know your competitor's strengths and weaknesses can be crucial to your business's success. The competitor analysis tool of VP Online features a powerful competitor analysis map that enables you to compare your brand with your competitors, giving you fast and valuable insights in identifying the best marketing strategies. The competitor analysis map can be customized to suit any needs. Plus, you can edit and access the analysis anywhere because VP Online is an online competitor analysis software that runs on any device, any browser.
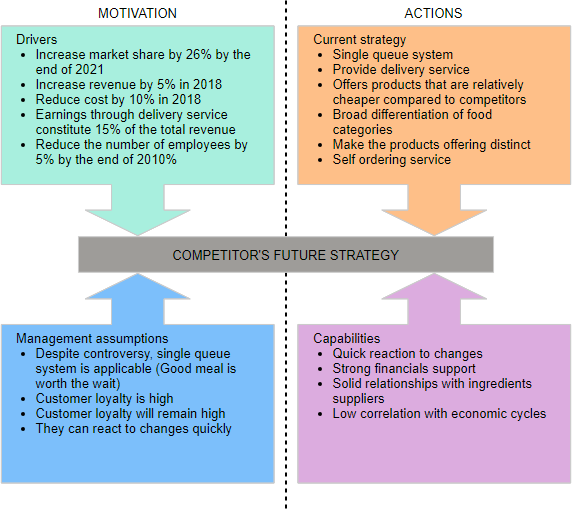
Four Corners Analysis Diagram
Four Corners Diagram, known as Four Corners Model, is a strategic analysis tool that helps determine a competitor's course of action by predicting future moves of your competitors based on your own strategic move. Unlike other predictive models which predominantly rely on a firm's current strategy and capabilities to determine future strategy, Four Corners model seeks for an understanding of what motivates the competitor. This added dimension of understanding a competitor's internal culture, value system, mindset, and assumptions helps in determining a much more accurate and realistic reading of a competitor's possible reactions in a given situation.
Four Corners Diagram refers to four diagnostic components that are essential to competitor analysis: future goals (also called drivers); current strategy; management assumptions; and capabilities.
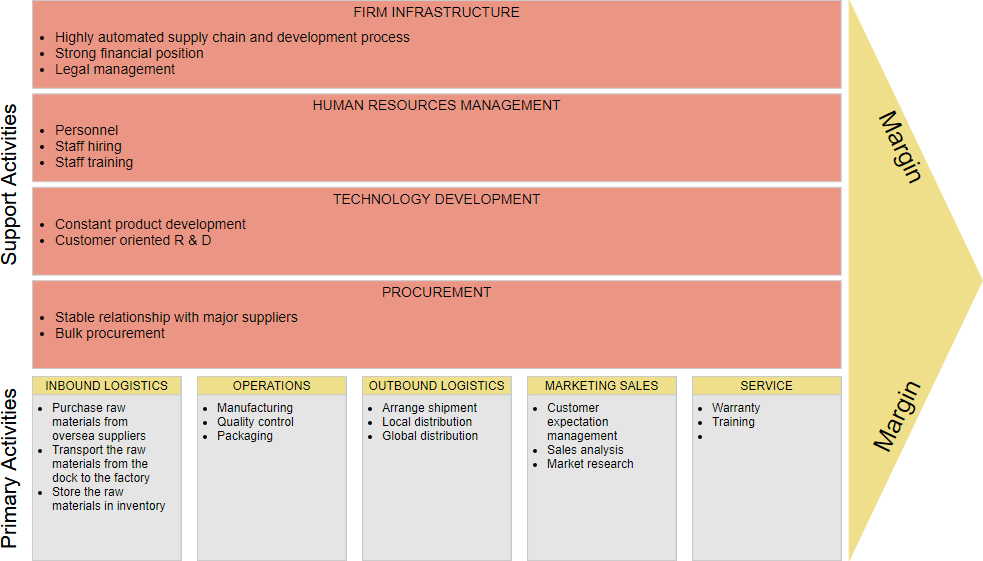
Value Chain Diagram
A value chain helps to identify which activities within the firm were contributing to a competitive advantage and which were not that involves breaking down the firm into five 'primary' and four 'support' activities, and then looking at each to see if they give a cost advantage or quality advantage.
Our Value Chain tool makes drawing process much easier by using bullet editor for auto layout and easy updating capability! You just need to enter the primary activities and support activities, then the Value Chain Diagram will be formed automatically. No more manual work or distorted graphics! Of course you can always adjust the height, color or any other look & feel as required.
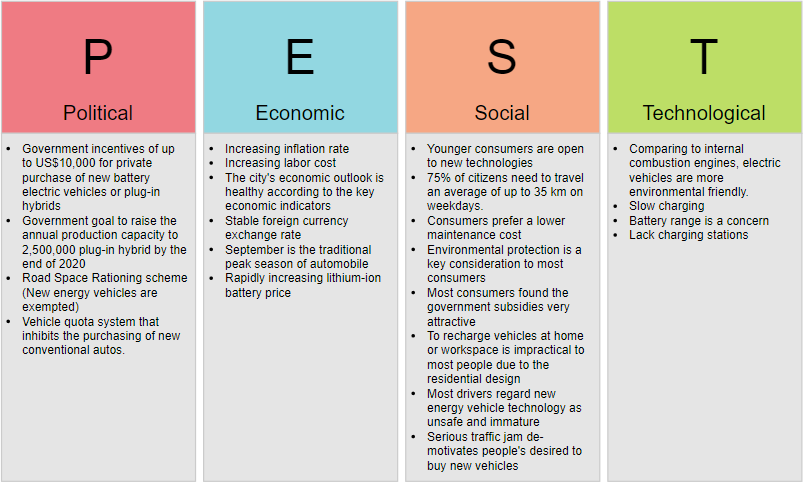
PEST Analysis Diagram (and PESTLE)
A PEST analysis is an analysis of the external macro-environment that effects all firms and industries. PEST is an acronym for Political, Economic, Socio-Cultural, and Technological factors of the external macro-environment. Each of the PEST factors may represent constraints or opportunities, depending on circumstances. They should periodically be identified, understood and analyzed by the company so it can achieve optimum performance.
As the factors vary, a PEST chart has many different forms such as PESTLE (i.e. PEST + Legal & Environment), SLEPT, STEPE, STEEPLE, etc. Nevertheless, PEST and PESTLE are by far the most widely used ones. The intuitive list-based editor is flexible enough to let you re-configure the template to match all these forms of PEST Analysis above easily.
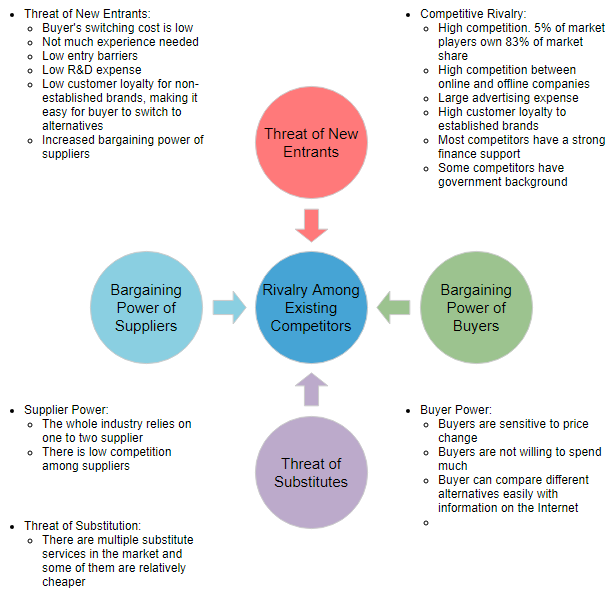
Five Forces Analysis Diagram
A Five Forces analysis can help companies assess industry attractiveness, how trends will affect industry competition, which industries a company should compete in, and how companies can position themselves for success.
Five Forces Analysis is a strategic tool designed to give a global overview, rather than a detailed business analysis technique. It helps review the strengths of a market position, based on five key forces. Thus, Five Forces works best when looking at an entire market sector, rather than your own business and a few competitors.
The Five Forces are: Threat of new market player, threat of substitute products, power of customers, power of suppliers, industry rivalry which determine the competitive intensity and attractiveness of a market.
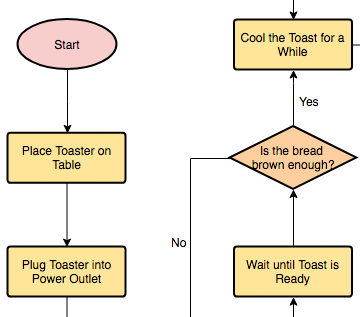
Quick Shape Creation
Turn ordinary text into something more visually appealing. The list-based editor can be used to draw attention to important information or to make information easier to interpret and understand.
The intuitive list-based editor allows a more accurate and efficient analysis process that lets your team to focus on analyzing, not drawing. One of the smart features is the automatic adjustment of cells' font size, which ensures that the text content in a graphic is always within shape boundary, remaining consistent regardless of diagram's size and among the different parts of the diagram. For instance, the content of the 'S', 'W', 'O' and 'T' cells in a SWOT Analysis diagram will always maintaining the same font size regardless of the volume of content in any particular cell.
