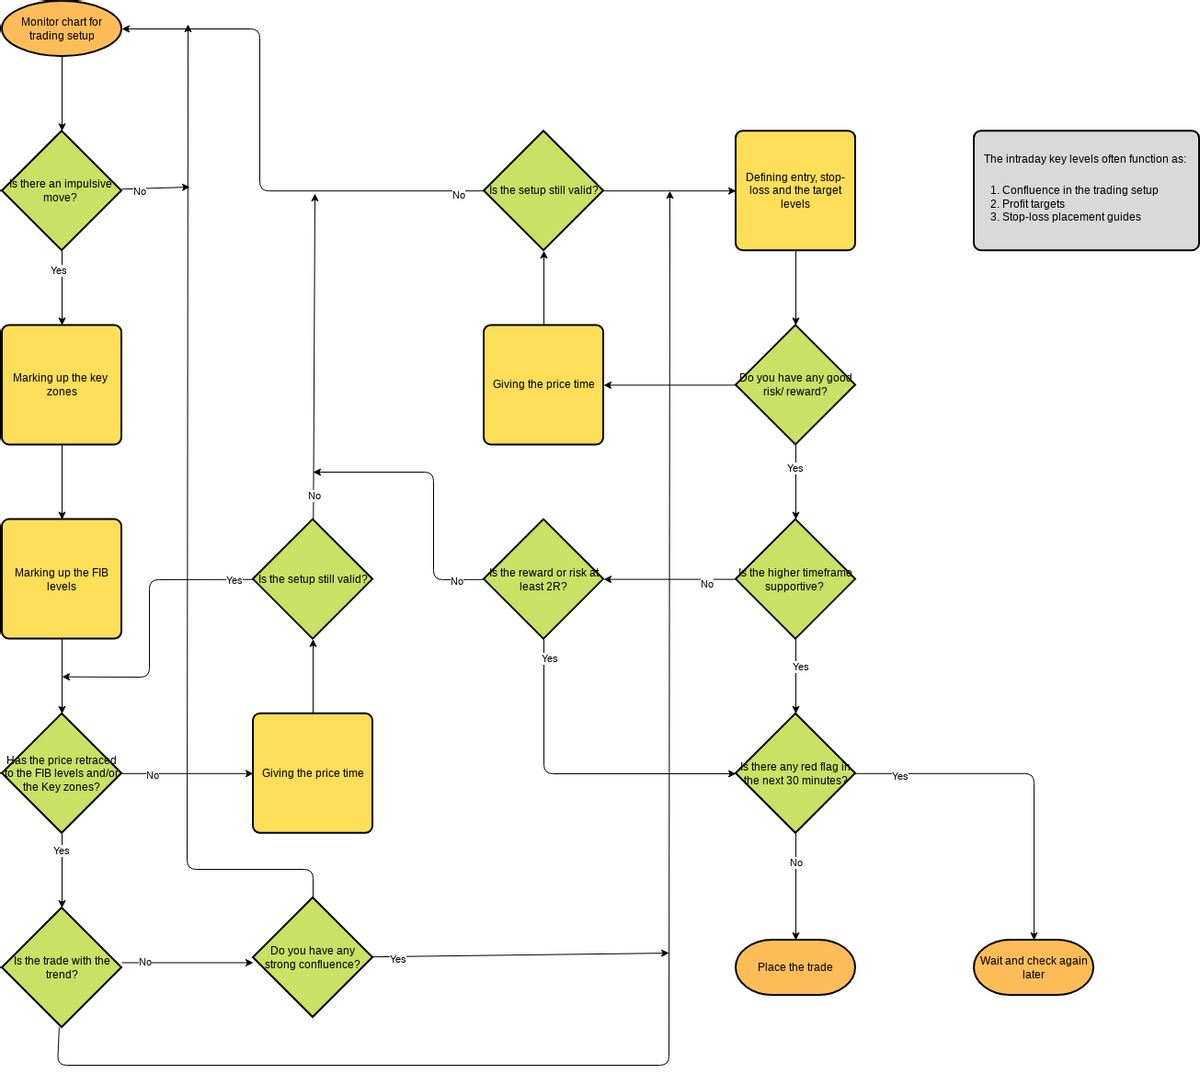
The Flowchart Example for FIBCON showcases the decision-making process involved in trading setups using FIB levels and key zones. The flowchart includes various steps, such as monitoring the trading chart, identifying impulsive moves, marking up key zones and FIB levels, assessing retracement, evaluating trade trends and confluence, considering risk-reward ratios, validating the setup, defining entry and exit levels, assessing higher timeframe support, checking for red flags, and ultimately placing the trade.
The flowchart begins with monitoring the trading chart and identifying impulsive moves. It then progresses through a series of decision points, including marking up key zones and FIB levels, assessing retracement, trade trend, and confluence. Further evaluations involve considering risk-reward ratios, validating the setup's ongoing validity, defining entry, stop-loss, and target levels, assessing higher timeframe support, and checking for any red flags within the next 30 minutes. Finally, the flowchart concludes with the action of placing the trade.
This flowchart provides a visual representation of the decision-making process for trading setups using FIB levels and key zones in the FIBCON methodology.
The template has been designed using Visual Paradigm Online, a comprehensive and user-friendly diagramming tool. Visual Paradigm Online offers a wide range of features and capabilities, making it an ideal choice for creating professional-grade diagrams like the Flowchart Example for FIBCON. With its intuitive interface and collaborative features, Visual Paradigm Online enhances the diagramming process, enabling users to create visually appealing and informative diagrams efficiently.


