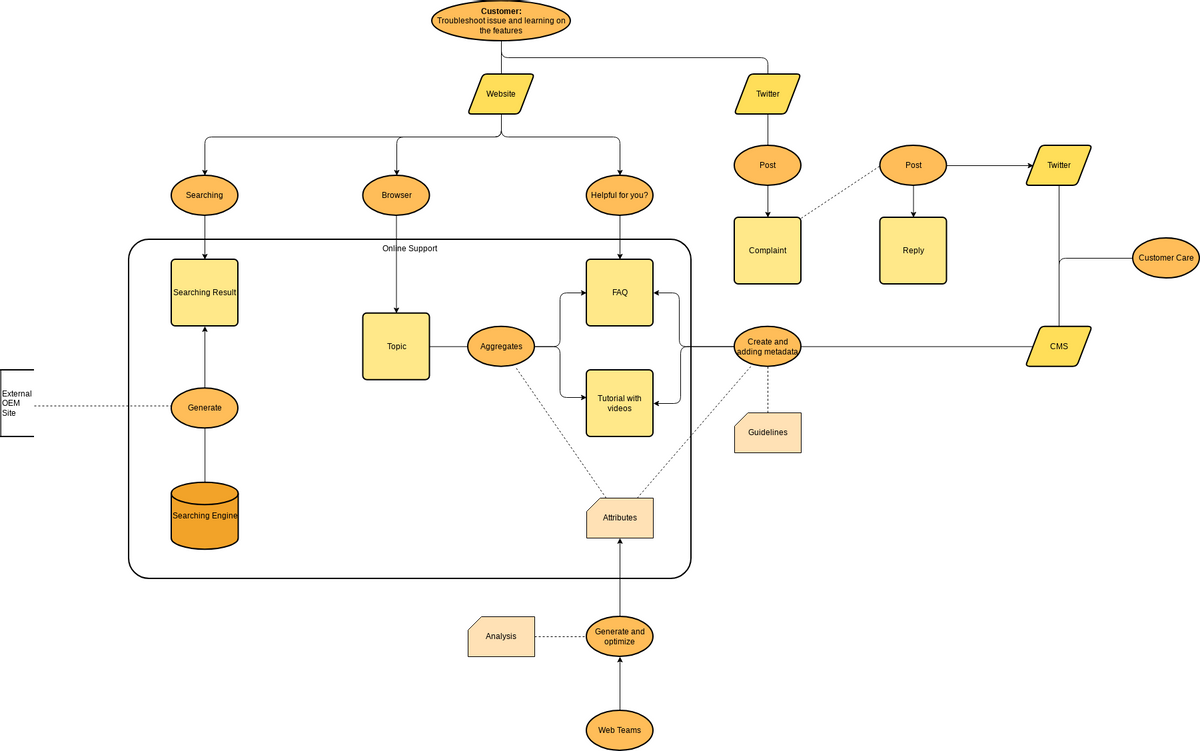
The Flowchart Example for Website and Twitter demonstrates the process of addressing customer issues and providing support through a website and Twitter. The flowchart includes actions such as troubleshooting issues, learning about website features, conducting searches, generating search results, utilizing topic aggregates, accessing FAQs and tutorial videos, generating and optimizing attributes, creating Twitter posts, posting complaints, and adding metadata according to guidelines.
The process begins with the customer encountering an issue and seeking assistance. The flowchart then branches out into two possibilities: troubleshooting the issue and learning about the website's features. If troubleshooting is chosen, the customer conducts a search using a browser and evaluates whether the search results are helpful. If the results are satisfactory, the process continues with utilizing topic aggregates. On the other hand, if the search results are not helpful, the customer proceeds to explore the FAQ section or tutorial videos.
At the next decision point, the customer evaluates whether the FAQ or tutorial content is helpful. If it is, the flowchart proceeds to generate and optimize attributes. If not, the customer decides to post a complaint on Twitter. The flowchart then guides the customer through the process of creating and adding metadata to the Twitter post, ensuring adherence to guidelines.
This flowchart provides a visual representation of the sequential steps involved in troubleshooting customer issues, learning about website features, and utilizing Twitter for complaint resolution and support.
The template has been designed using Visual Paradigm Online, a comprehensive and user-friendly diagramming tool. Visual Paradigm Online offers a wide range of features and capabilities, making it an ideal choice for creating professional-grade diagrams like the Flowchart Example for Website and Twitter. With its intuitive interface and collaborative features, Visual Paradigm Online enhances the diagramming process, enabling users to create visually appealing and informative diagrams efficiently.


