Make a professional design is so easy with a professional design tool like Visual Paradigm Online. It provides abundant templates and a rich set of powerful InfoChart widget for data visualization. You can select a template, drag an InfoChart onto the design and adjusting the value thorugh drag-and-drop. The powerful editing tools enable you to finish your design without much time and effort.
Laboratory Template Specifications:
Customizable:
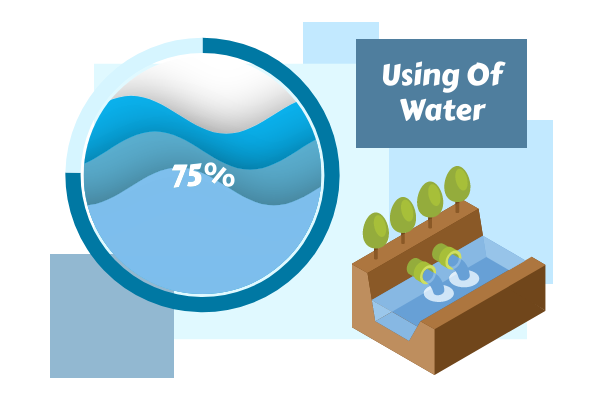
Here is a template that shows you how to use the InfoChart to create beautiful design. Simply click on the Edit button to get started. Edit the chart data, touch-up the color and font to complete it. Get things done in minutes.
Dominant Color
Palette
Dimension
600 x 400 px


