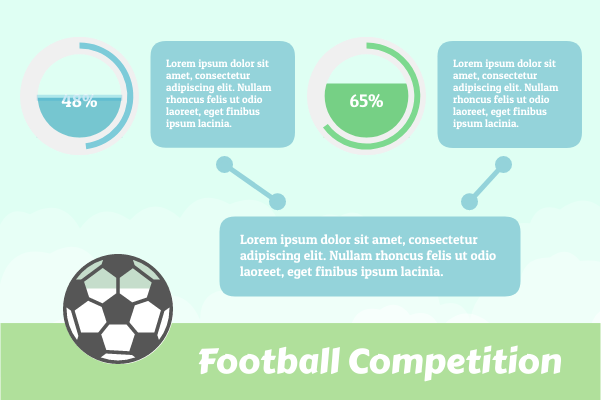
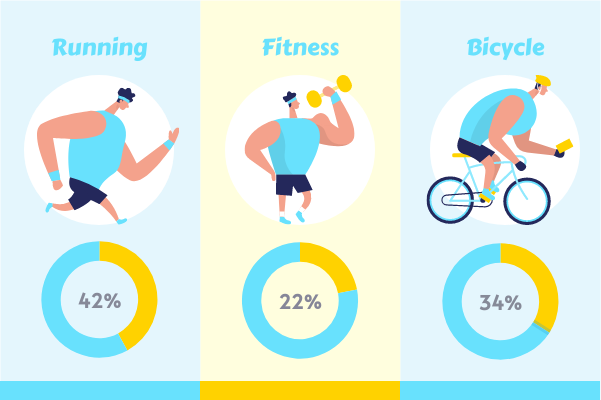
Visual Paradigm Online allows you to create beautiful visuals easily. InfoChart, one of its design feature, provides you with a large set of interactive components for data visualization. You can include InfoChart in your infographic, presentations and other visual, and tweak the value through drag-and-drop.
Sport Template Specifications:
Customizable:
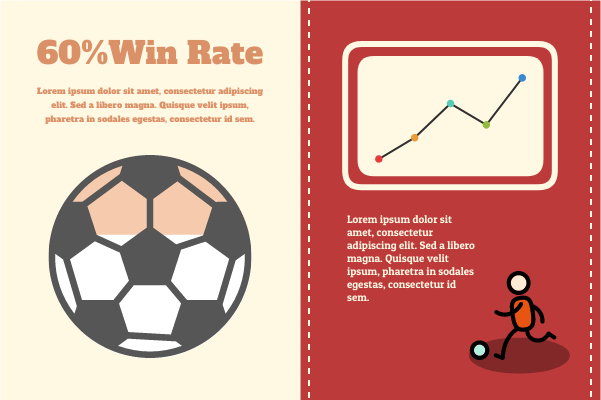
Here is a template that shows you how to use the InfoChart to create beautiful design. Simply click on the Edit button to get started. Edit the chart data, touch-up the color and font to complete it. Get things done in minutes.
Dominant Color
Palette
Dimension
600 x 400 px
