A PICK chart (also known as PICK Diagram) is a Lean Six Sigma tool, developed by Lockheed Martin for a lean product, for organizing process improvement ideas and categorizing them during the Identify and Prioritize Opportunities Phase for easy review and analysis.
A PICK chart allows visual comparison of action items relative to their impact on the problem being addressed vs. the ease/cost of implementation. It is great for brainstorming and planning sessions. It’s easy to set up, easy to understand and allow project managers to focus the discussion and achieve a consensus.
There are four categories on a 2*2 matrix; horizontal is a scale of payoff (or benefits), vertical is the ease of implementation. By deciding where an idea falls on the pick chart four proposed project actions are provided; Possible, Implement, Challenge and Kill (thus the name PICK).
- Possible – Low payoff, easy to do
- Implement – High pay off, easy to do
- Challenge – High payoff, hard to do
- Kill – Low payoff, hard to do
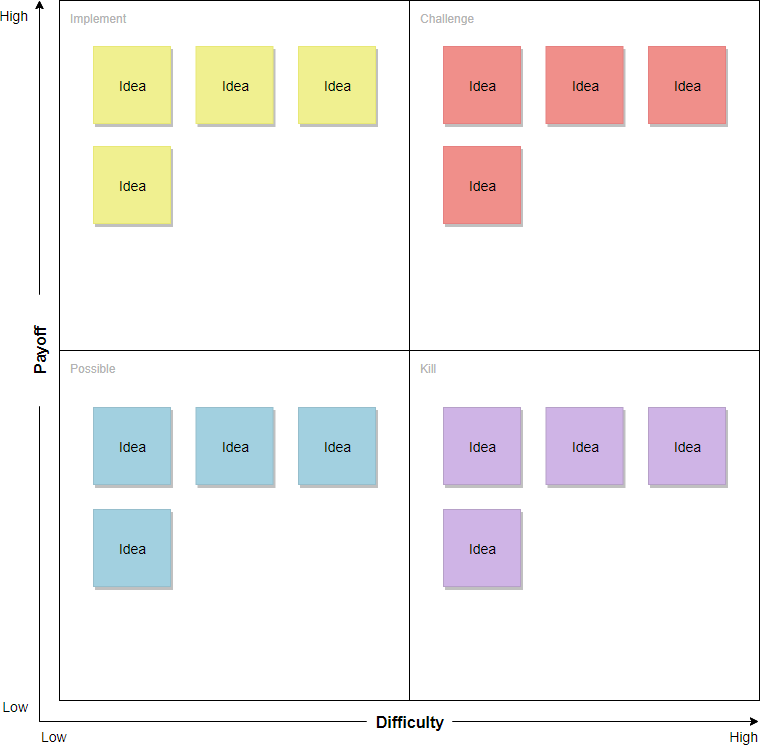
Edit this PICK diagram example
Summary
Once each idea from the brainstorming session has been placed on the most appropriate square, it becomes easier to identify which ideas should be acted on first. Although PICK charts are often associated with the Six Sigma management philosophy, now, a PICK chart can be found in many disciplines outside manufacturing including education, marketing, and agile software development.