InfoChart are content widgets designed for data visualization. You can include InfoChart in your presentation, infographic and other design, and adjust data easily through simple drag-and-drop.
Progress Template Specifications:
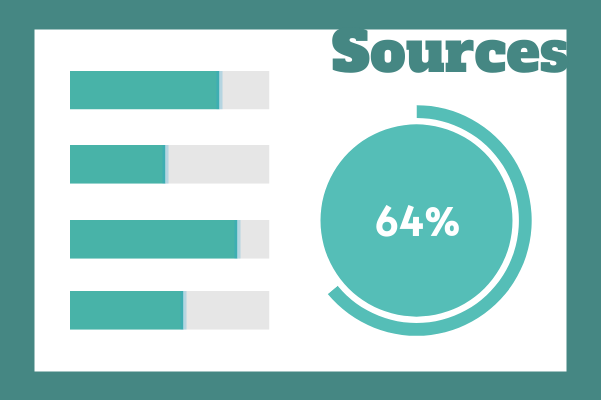
Customizable:
Here is a template that shows you how to use the InfoChart to create amazing design. The template is customizable and can be tailored to suit your needs in just minutes. You can edit the background, color and font. You can also add additional icons, photos and text blocks if necessary.
Dominant Color
Palette
Dimension
600 x 400 px


