Create InfoChart to show your data visually. Visual Paradigm Online offers a wide varity of InfoChart objects to represent statistic and figures. Feel free to customize the widgets to fit your need. Change the color, font, etc. Let's have a try now!
Progress Template Specifications:
Customizable:
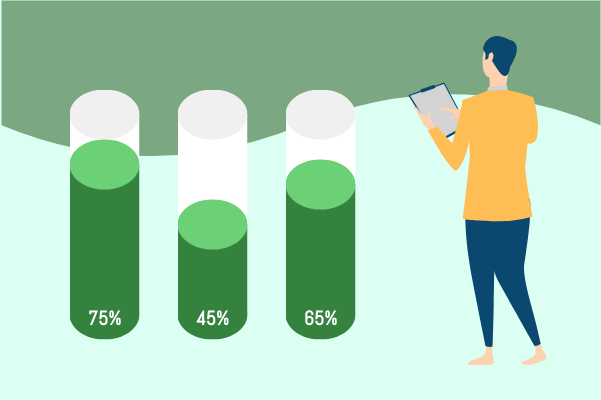
Here is a template that shows you how to use the InfoChart to create beautiful design. Click Edit to get started. Replace your own data and personalize the design by modifying the background image, the color and font. We features an unbeatable collection of high-quality stock photos to support your design needs.
Dominant Color
Palette
Dimension
600 x 400 px


