Visual Paradigm Online supports a specially designed InfoChart widget to support differnet kinds of data visualization needs. Simply drag an InfoChart to your design, adjust the color and font, drag the value, and done! Let's have a try now!
Progress Template Specifications:
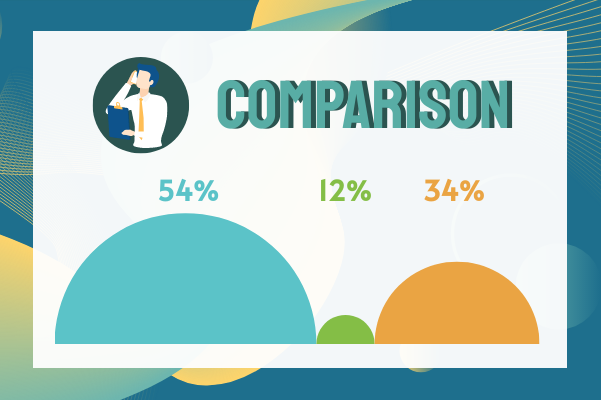
Customizable:
Here is a template that shows you how to use the InfoChart to create beautiful design. Click on the Edit button to begin, edit the data, and customize anything from the color and fonts to the placement of icons and background. The template is perfect for those who want to create an impressive infographic, presentation or report.
Dominant Color
Palette
Dimension
600 x 400 px


